A cloud GPU SKU is a promise of software compatibility, not a guarantee of delivered throughput. Two instances can report the same accelerator name and memory capacity while producing different matrix throughput, device-memory bandwidth, or useful tokens per dollar. The gap matters because an AI operator buys completed work, not a label in a catalog.
Silicon Data and two William & Mary researchers measured this problem across 11 cloud providers.[1] The data set contains 3,534 physical NVIDIA GPUs, more than 6,800 benchmark samples, and four months of observations. The providers include hyperscalers and neoclouds, although the paper anonymizes them because of service terms and legal considerations. This is not a provider ranking. It is evidence that a nominally identical cloud product arrives as a performance distribution.
The measurement boundary is deliberately small
The authors built QuickMark in PyTorch and used two short tests. One multiplies 16,384 by 16,384 FP16 matrices and reports TFLOPS. The other copies 1 GB between locations in device memory and reports GB/s. Tests ran with each provider’s default operating system, CUDA stack, and drivers. GPU UUIDs let the researchers distinguish another execution on the same physical device from a new allocation.
That distinction is the foundation of the paper. Execution-level variation measures how much repeated runs move on one GPU. Intra-provider variation compares physical GPUs of the same model inside one provider. Inter-provider variation compares the same model across providers. Of the observed devices, 746 had at least three samples, which allowed the first two levels to be separated rather than mixed into one range.
The boundary is also a limitation. A matrix multiply and a memory copy are diagnostic probes, not an AI cluster. They largely omit host CPUs, PCIe paths, network fabrics, storage, collective communication, virtualization interference, and failure recovery. Their value is that they are cheap enough to repeat across thousands of rentals and narrow enough to reveal whether variation begins below the application.
Repeating one run does not explain the fleet spread
Across the paper’s evaluated models, the maximum normalized range for repeated executions stayed below 9%. Most devices were tighter: 83% remained within 2% for FP16 matrix multiply, and 92% remained within 2% for device-to-device memory copy. A careful benchmark still needs warm-up, synchronization, and repeated samples, but run noise alone cannot explain the larger gaps in cloud inventory.
The population ranges were substantially wider. H100 PCIe reached a 34.49% inter-provider FP16 range, while H200 SXM reached a 37.82% inter-provider memory-copy range. A100 SXM4 showed 19.12% across providers for FP16 and 17.19% for memory copy. In several cases, the intra-provider range was almost as large as the inter-provider result. Buying from one provider therefore did not always collapse the distribution to one performance level.
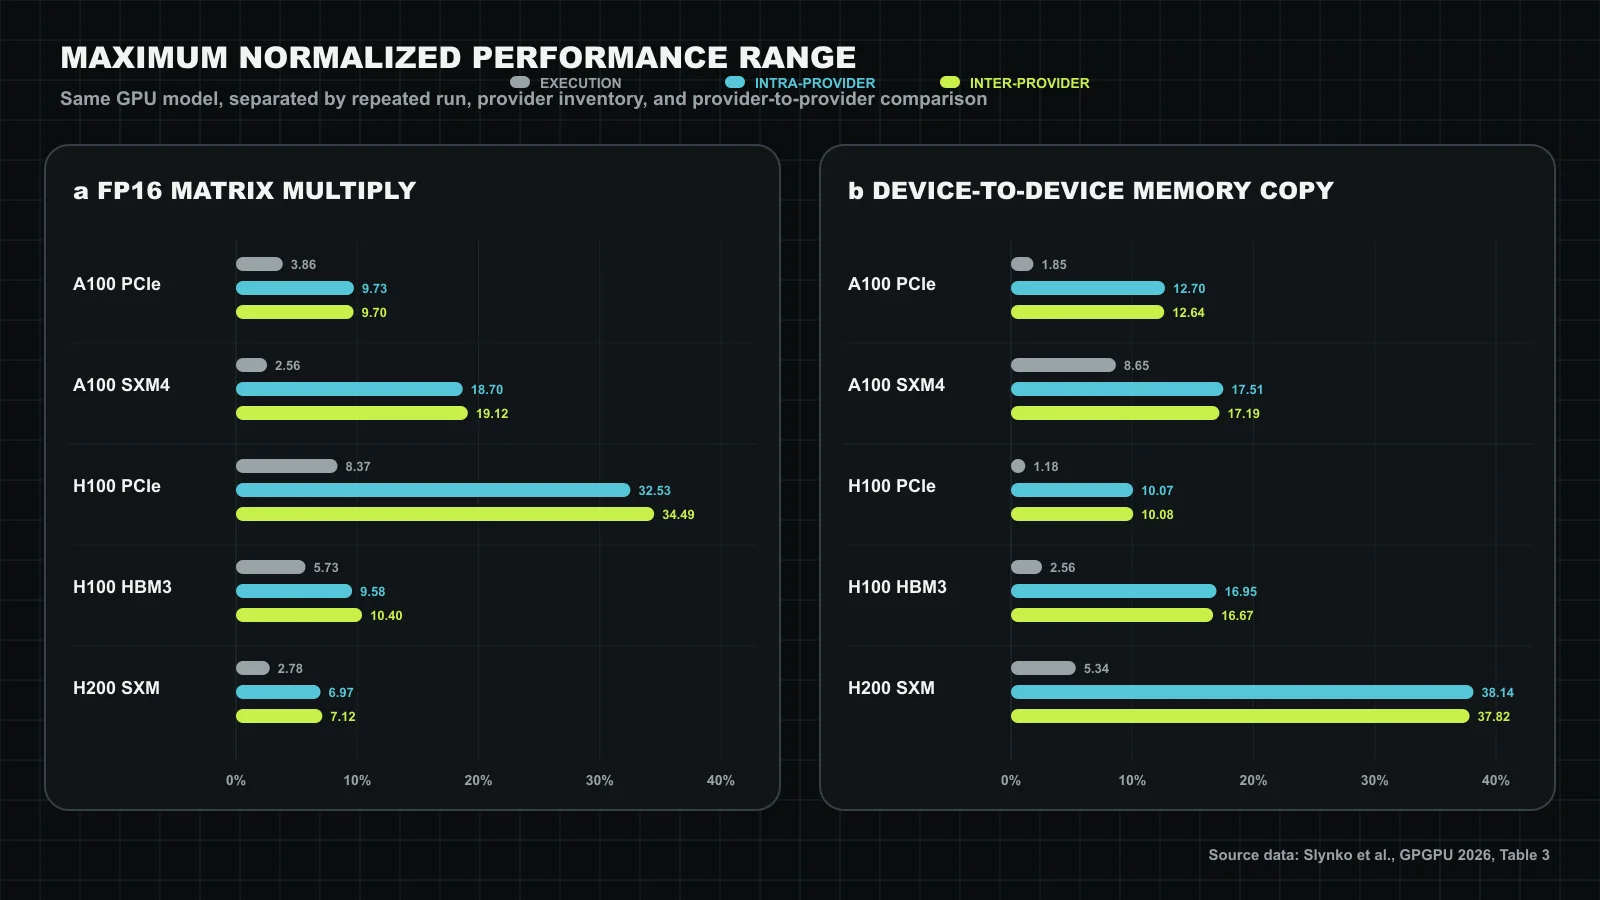
The H200 result is particularly useful because the paper provides an absolute comparison. Average memory-copy bandwidth was 4,145 GB/s at one anonymized provider and 3,170 GB/s at another, a 31% gap. Some distributions were bimodal around roughly 3 and 4 TB/s rather than smoothly dispersed. The authors do not identify the mechanism, so the two modes should not be assigned to a firmware version, power limit, thermal policy, or silicon bin without additional evidence.
The provider and the physical device are both part of the product
The authors regress performance against provider, GPU identity, and month. Month contributes less than 1% of the modeled variance. GPU identity accounts for 32% to 73%, and six of seven reported models reach an R-squared between 0.97 and 0.99. Their interpretation is that the physical device dominates time drift.
That is strong evidence for persistent differences, but it is not a causal diagnosis of manufacturing variation. A GPU UUID is nested inside a provider environment. The regression does not independently randomize firmware, cooling, host configuration, board power limits, binning, or data-center policy. The practical conclusion is narrower and more defensible: an allocation’s identity predicts performance well enough that buyers should retain it in their records and retest replacement hardware.
Provider defaults also belong inside the measured product. Cloud users usually receive a combined service consisting of a board, host, firmware, driver, power policy, and operational controls. A nine-percent mean FP16 difference between the paper’s two anonymized H100 PCIe providers can therefore be commercially real even when the silicon model is identical. Procurement cannot dismiss it as an implementation detail if customers cannot change the implementation.
Microbenchmarks become useful only when they predict work
The paper connects the probes to LLM serving with Llama-3.1-Nemotron-Nano-4B-v1.1 under vLLM. The model uses BF16, occupies 8.4 GiB for weights, and receives 58 GiB for its KV cache. The authors test a chat shape with 128 input and 128 output tokens and a summarization shape with 4,096 input and 512 output tokens. Concurrency is 1, 25, 50, or 100. They intentionally avoid tensor parallelism and application-specific tuning.
This setup exposes two different resource balances. At chat concurrency 100, H100 throughput is about 3% higher than H200. For summarization, H200 leads by 10% at concurrency 25 and by 16% at concurrency 100. The larger H200 memory system matters more when requests carry a long prompt and enough concurrent KV-cache traffic. A model name alone therefore does not determine which accelerator is better; the input-output shape and concurrency decide which hardware resource becomes useful.
The application sample is much smaller than the microbenchmark population. It contains 61 H100 SXM samples from 18 devices at two providers and 23 H200 SXM samples from nine devices at one provider. Within one provider, the maximum throughput range is 6.3% in one set. Another provider’s chat test at concurrency 100 spans 29% for H200 and 53% for H100. Those values show that application variability can exceed a short probe, but the small and uneven sample prevents a universal conversion from bandwidth range to tokens per second.
The correct use of QuickMark is consequently diagnostic. If memory-copy bandwidth is low and a long-context workload is also slow, the probe helps locate the bottleneck. If a compute probe moves but the application does not, the application may be limited elsewhere. A procurement decision should never replace the target workload with a microbenchmark merely because the latter is easier to run.
Tokens per dollar is dated evidence, not a permanent ranking
The study combines measured throughput with listed rental prices on one day. Within the same GPU model, the best-to-worst tokens-per-dollar ratio reaches 1.61 times. For the H100 comparison that produced this largest ratio, the paper attributes most of the spread to provider pricing rather than performance dispersion. H100 and H200 value distributions overlap, so a more expensive H200 can deliver more summarization throughput without producing more useful tokens per dollar than a well-priced H100.
This result answers a purchasing question more directly than peak TFLOPS, but its date boundary must remain visible. Cloud prices, reserved discounts, egress fees, minimum commitments, availability, and interruption policy change. A one-day public rate also excludes engineering cost and the probability that the required number of GPUs can be allocated together. The 1.61 times result is an observed spread under the paper’s price snapshot, not a stable market constant.
Useful cost should include only requests that meet the service objective. Tokens from a response that violates tail-latency, accuracy, or availability requirements may have little economic value. Power is also absent when it is bundled into the rental price, yet it can reappear through colocated capacity or long-term contracts. A complete denominator is successful, SLO-valid work over the full commitment period.
A cloud GPU acceptance test should have four layers
The paper’s evidence supports a practical qualification process. First, record the exact GPU form factor, region, host class, driver, and GPU UUID. Repeat the probe on that physical unit to estimate execution noise. Then request new allocations so persistent device and provider variation can be measured rather than hidden inside an average.
Second, replay the intended application. Pin model version, precision, input and output distributions, concurrency, batch policy, runtime, and latency objective. Report P5, P50, and P95 throughput across allocations together with tail latency and failure rate. An average alone cannot reveal whether the bottom of the inventory violates the service contract.
Third, price every result on the same date and with the same commitment assumptions. Include usable runtime, reservation terms, data transfer, orchestration overhead, and the capacity actually available in one failure domain. Finally, state when a replacement host, driver update, or material drift triggers retesting. The acceptance rule should survive the first allocation.
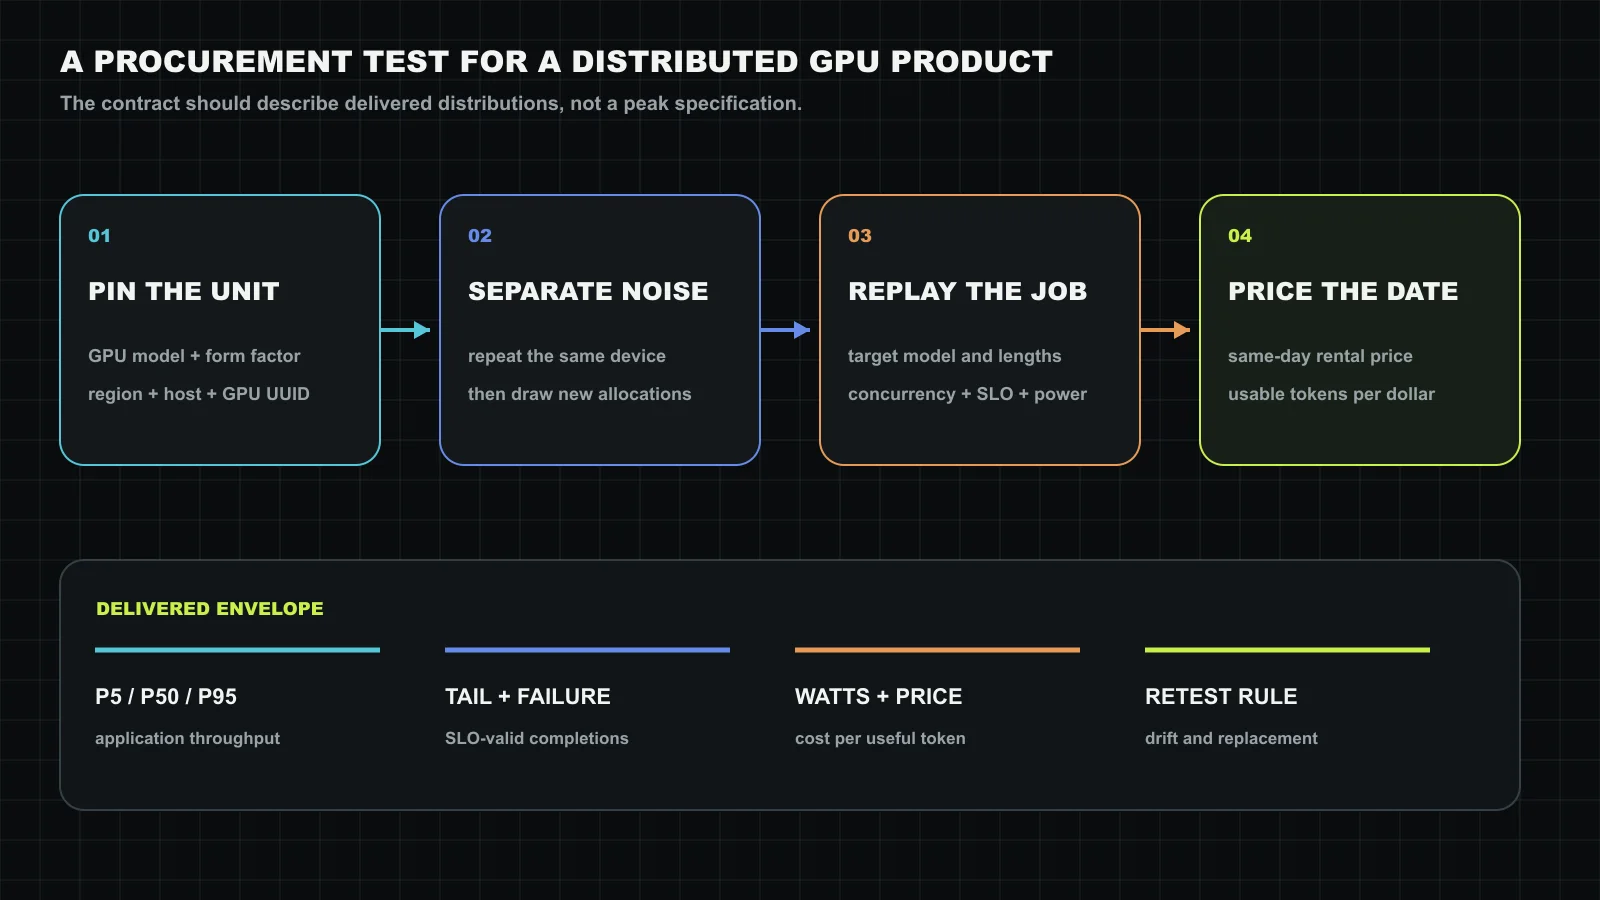
This procedure changes the contract language. Instead of accepting “H100” as the performance requirement, the buyer can specify a workload, configuration, sample count, percentile floor, SLO, and retest condition. Providers can answer with an inventory distribution rather than a favorable single machine. The SKU remains necessary for compatibility, but it is no longer treated as sufficient evidence of capacity.
What standardized benchmarks teach this market
The strong response to our SPEC CPU 2026 review is consistent with a broader pattern: readers value a benchmark when its rules make unlike systems comparable and when the score changes a decision. SPEC CPU 2026 standardizes a heterogeneous CPU workload construction. DCPerf asks whether a runnable suite predicts production services closely enough to guide server purchases. MLPerf Power fixes measurement boundaries for energy, while MLPerf Storage exposes the storage system that feeds accelerators.
The GPU cloud paper fills a different layer. It does not propose a neutral industry standard, and Silicon Data has a commercial interest in benchmarking products. Instead, it measures the inventory distribution that a standardized test would need to represent. The paper’s most valuable question is not which anonymized provider wins. It is whether the unit of comparison should be one configured accelerator or the range a supplier can repeatedly deliver.
These benchmark types are complementary. A suite specification fixes the rules. A correspondence study checks whether the suite represents production. A population study checks whether the purchased product is uniform. A cost study places the result over a denominator that a buyer pays. Collapsing the four into one score makes the number easier to share but weaker for engineering decisions.
What the paper cannot establish
The providers are anonymized, so the results cannot support a current purchasing ranking or a claim about any named cloud. Inventory sampling is opportunistic rather than a balanced random experiment. Some GPU models and providers have many more observations than others, and the LLM-serving subset is particularly small.
The study covers NVIDIA accelerators and two microbenchmarks. It does not isolate CPU, PCIe, network, storage, collective communication, tensor parallelism, expert parallelism, multi-node scheduling, or failure recovery. The 4B model and synthetic sequence lengths do not represent every production model. Default software improves realism for a rental but prevents clean attribution of hardware, firmware, and software effects.
Silicon Data develops and sells SiliconMark benchmarking and market-index products. That commercial position does not invalidate the measurements, but it raises the standard for disclosure, reproducible code, provider-balanced sampling, and independent replication. The public paper describes its method and license, while the provider identities and full raw inventory are not presented as an open comparison data set.
What we take from it
The paper turns a familiar complaint about inconsistent cloud GPUs into a measurement hierarchy. Repeated-run noise is usually the smallest layer. Persistent differences appear across physical units and providers, and some of them survive into LLM throughput and tokens per dollar. The evidence does not tell us which hidden mechanism causes every gap, but it is sufficient to reject the assumption that a GPU name defines one delivered performance level.
For an operator, the practical change is straightforward: retain GPU identity, sample more than one allocation, replay the real request distribution, and purchase a percentile envelope. For a provider, publishing that distribution can become a product feature. The next useful benchmark is not another peak number. It is a reproducible contract for the work a customer will actually receive.
Source and attribution
This editorial digest uses independent wording, one original conceptual hardware plate, and two original code-generated figures. It reproduces no prose, figure, or table layout from the source. Numerical values are replotted from the authors’ reported data. The public paper is licensed under CC BY-NC-ND 4.0; copyright is held by the authors, © 2026. Silicon Data develops commercial benchmark and market-index products discussed by the paper.