The arithmetic that opens this paper is worth quoting in substance. Between 2017 and 2022, a generation’s flagship GPU improved by 4× in floating-point throughput (V100 to H100), while the compute demanded by frontier models grew by 1500× (BERT-base to GPT-3). For an operator in China the gap is wider still, since the accelerators legally available there are deliberately derated versions of the flagship parts. Tencent, which serves 1.4 billion active users with an in-production model above one trillion parameters, draws the only conclusion the arithmetic allows: performance per chip is not on the menu, so the datacenter must supply the missing factor as scale. Astral, presented at SIGCOMM 2025 by Tencent with Nanjing University, Harvard and Politecnico di Milano[1], is the infrastructure that results, a fabric designed for 512K GPUs of which 128K across two Pods are already live after 18 months of gradual deployment. The paper reads as three papers in one (a network architecture, a monitoring system, and a performance forecaster), and we take them in that order, because each exists to protect the investment made by the previous one.
We restate the argument in our own words below.
A fabric that keeps every rank on its rail
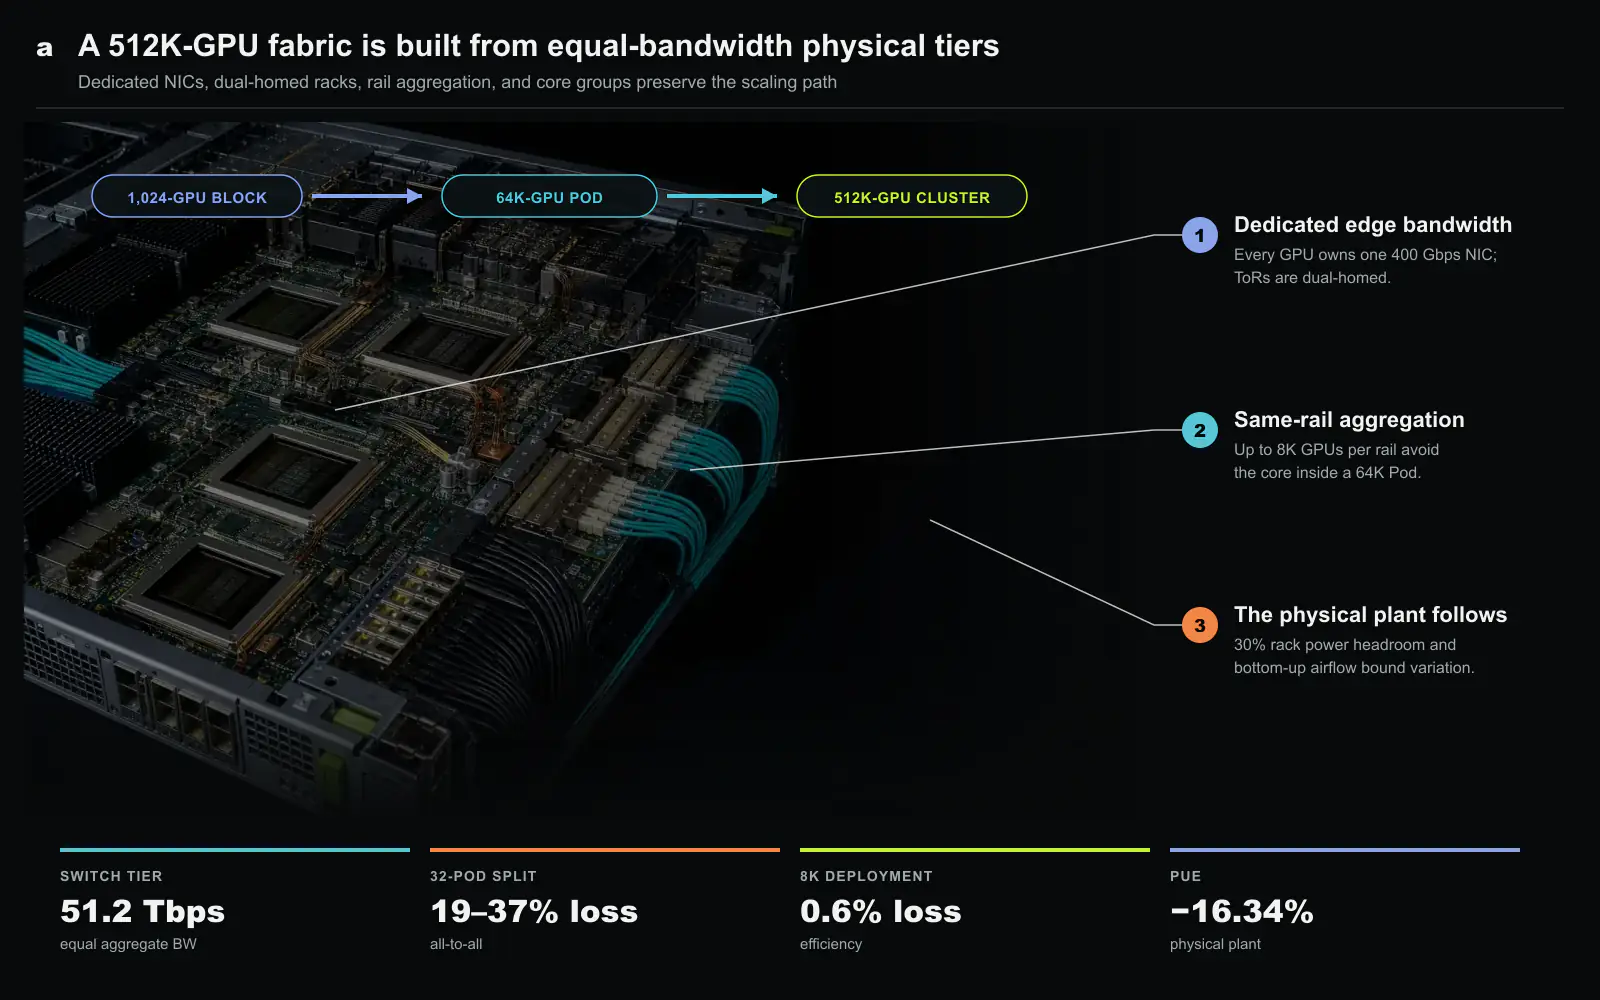
Astral’s host is conventional: 8 GPUs behind an NVLink-class intra-host network, 8 NICs of 2×200 Gbps, one NIC per GPU, so each accelerator owns a dedicated 400 Gbps of RDMA and a server presents 3.2 Tbps to the fabric. The interesting decisions start one tier up. Modern collective libraries route inter-host traffic so that GPUs of the same rank (the same “rail”) talk to each other, and Astral’s production statistics confirm that most traffic stays on-rail once that optimization is active. The architecture therefore aggregates same-rail top-of-rack switches at tier 2: a block of 1,024 GPUs terminates in 16 dual-homed ToR switches (each NIC’s two ports land on different ToRs, so no single switch or optical module failure strands a server), and the same-rail ToRs of many blocks concentrate into groups of 64 aggregation switches. The result is a Pod of 64K GPUs in which any two same-rank GPUs, up to 8K of them per rail, reach each other without crossing the core layer at all. Cross-rail traffic still has a path, through 64 core switches per group, which distinguishes Astral from Meta’s rail-only proposal, where cross-rail communication must detour through the hosts’ internal interconnect.
The second decision is the expensive one: identical aggregated bandwidth at every tier, meaning no oversubscription anywhere in the three levels of 51.2 Tbps switches. Meta, ByteDance and Alibaba all oversubscribe between aggregation and core[2][3][4], reasoning that little traffic reaches tier 3. The paper’s measurements explain why Tencent declined to follow. Splitting a 1K-GPU all-to-all job across 32 Pods instead of one costs 19 to 37% of collective throughput, and tier-3 oversubscription costs up to 52% of all-to-all throughput and 3% of end-to-end training performance, a number that matters because only about 15% of communication time survives overlap with computation. The sensitivity is architectural: dense transformers push data-parallel AllReduce and pipeline point-to-point traffic that stays on-rail, while mixture-of-experts models push expert-parallel all-to-all that does not, and MoE is where the field is going. For a company renting GPUs to customers whose allocations fragment and grow unpredictably, uniform bandwidth is less a performance feature than a product guarantee: any subset of the machine behaves like any other. Load balancing stays with ECMP, but with a two-step repair loop: UDP source ports are chosen per flow to spread paths evenly, and when a switch’s ECN counters still report congestion, a central controller re-runs the switches’ own hash function in simulation and reassigns source ports for the offending flows.
Below the network sits the physics bill that a 512K-GPU design forces you to pay. A server’s draw rises 8× (1 kWh to 8 kWh) when GPUs move in, so Astral replaces AC-plus-UPS power with a distributed high-voltage DC system, one unit per row of racks, that charges batteries directly, rides out the 20 to 30% capacity swings LLM training induces, and lets an individual rack borrow up to 30% above its rated power for the moments in each iteration when GPUs exceed TDP. Rooftop solar and wind supplied 22% of the energy in 2024. Cooling followed its own two-step evolution: turning the airflow vertical (bottom-up instead of side intake) cut inter-rack temperature variation from 1 degree Celsius to 0.11, and cold plates handle the hottest components while sharing a single primary cold source with the air loop, since the right liquid-to-air ratio depends on workload and had to remain adjustable over a facility’s decade of life. Averaged out, Astral’s PUE improves on Tencent’s traditional datacenters by 16.34%. One operational detail says much about the business: GPU power traces show a daily tide, high while users are awake and sagging overnight (roughly 22:00 to 08:00) as inference sleeps, and since the utility contract is for constant power, Tencent prices nighttime training rentals at a discount to fill the trough.
Monitoring that follows a fault down the stack
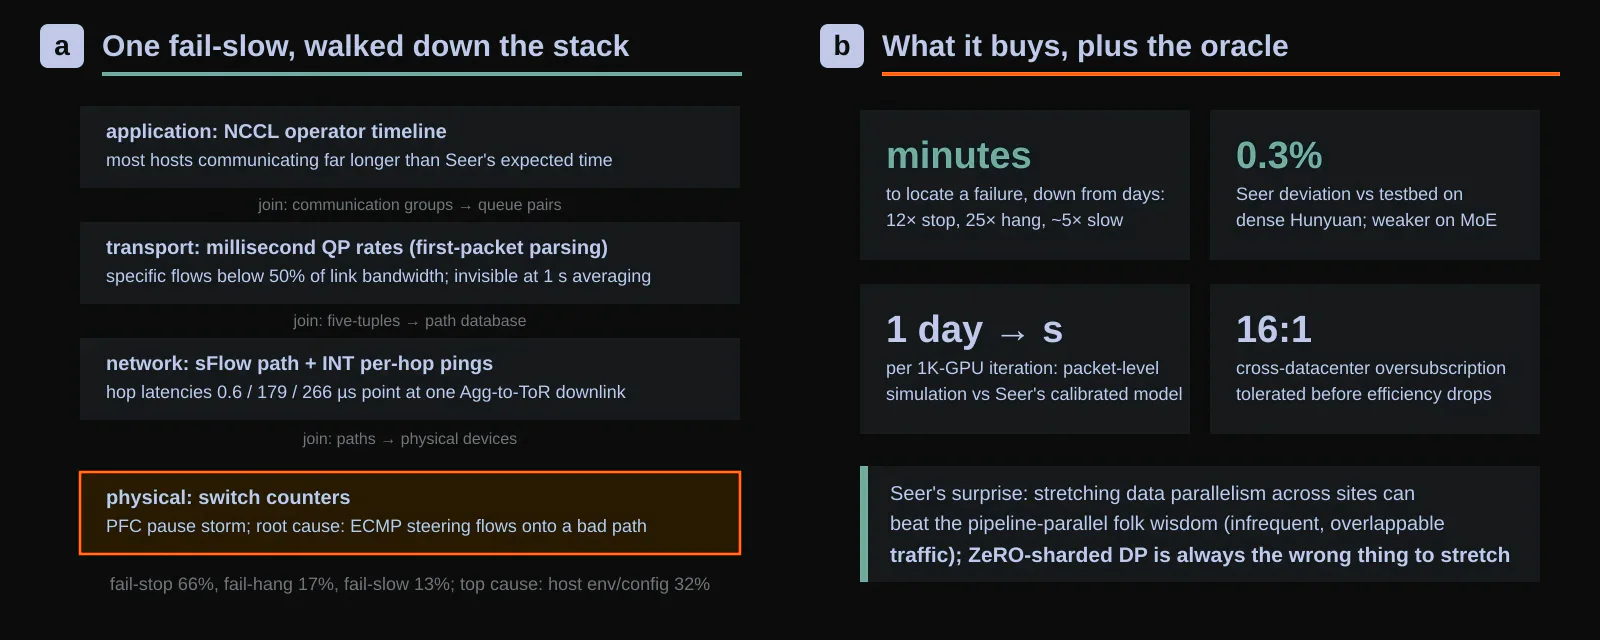
The second system exists because the first one breaks. Astral’s production taxonomy sorts anomalies by how they look before asking why they happen: 66% of failures are fail-stop, 4% fail on start, and the remaining 30% are the expensive kind, fail-hang (17%) and fail-slow (13%), which produce no error message at all. On the cause side, host environment and configuration problems lead at 32%, ahead of NIC errors (15%), user code (14%) and switch misconfiguration (14%), which is to say that most incidents are born before or beside the training job, not inside it. The diagnostic problem is that the mapping between symptom and cause is many-to-many: a GPU fault and a network fault produce the same NCCL timeout, while a hang produces nothing.
Astral’s answer is a monitoring stack that is less notable for any single sensor than for the joins between them. The application layer tracks every NCCL operator’s start and finish per iteration, giving a per-host picture of who is computing, who is communicating, and who has stopped. The transport layer captures RDMA error events and, more unusually, per-queue-pair throughput at millisecond resolution, obtained by filtering the first packet of each RDMA request and reading the transfer length from its header; the paper shows a case where second-level averaging simply cannot distinguish a sick flow from a healthy one. The network layer reconstructs each flow’s switch-by-switch path with sFlow sampling and probes it hop by hop with in-band telemetry pings. The physical layer collects switch counters (PFC, ECN, drops) and host internals. The join keys are deliberate: the job’s communication groups map to queue pairs, queue pairs carry five-tuples, five-tuples index the path database, and paths name physical devices. Detection is cross-host and largely threshold-free (a node whose metrics diverge from the cohort is suspect, with expected values supplied by the forecaster described below), and diagnosis walks downward through the joins. A production fail-slow illustrates the full walk: the NCCL timeline flags widespread slow communication, millisecond QP rates show some flows below half of link bandwidth, per-hop telemetry finds latencies of 0.6, 179 and 266 microseconds along one path, and switch counters reveal a PFC pause storm on an aggregation-to-ToR downlink, with the root cause finally pinned on ECMP steering flows into an inefficient upstream path. One year in, mean time to locate a failure fell from days to minutes: 12× faster for fail-stop, 25× for fail-hang, about 5× for fail-slow.
The war stories are candid about what the system cannot do. A fail-hang at 8K GPUs produced no abnormal logs anywhere; binary-search isolation failed because the fault vanished at smaller scale, and several dozen engineers spent 26 hours swapping machines in hour-long batches before maintenance records identified a specific NVIDIA driver version as the culprit. A single broken PCIe link on one machine, invisible to the then-current monitors, generated a PFC storm that halved the training efficiency of every tenant on the cluster; physical-layer PCIe monitoring was added afterward. Offline tooling earns its place here too, since 32% of failures trace to host environment and configuration: a wiring verifier that reconciles MAC addresses and slot IDs against the intended topology (early deployment staff miswired the 512K-port design repeatedly), and configuration checks that catch rented servers arriving with mismatched congestion-control parameters, driver versions and NCCL builds.
Seer: a forecast in seconds, correct to 0.3%
The third system exists because both of the others need a reference answer. Astral Seer forecasts the operator-level execution timeline of a training or inference job: what should this iteration cost, operator by operator, on this hardware and this network. Existing packet-level simulators were rejected on throughput grounds (one iteration of a 1K-GPU job took ASTRA-sim a day on a 48-core server, and SimAI several hours), and existing operator-level tools ignore packet effects entirely. Seer splits the difference. Operator dependency graphs come either from PyTorch profiler traces converted through Chakra or from hand-written JSON templates when researchers want to model operators that do not exist yet. Execution times start from the naive formula (tensor size over theoretical bandwidth) and are then corrected against production: polynomial fits map arithmetic intensity to measured FLOPS, memory traffic to measured HBM throughput, and message size to measured network throughput, so packet-level reality enters through calibration rather than simulation. A rental business turns out to be an advantage here, since many customers generate calibration data across many configurations. The result forecasts a timeline in seconds and lands within 0.3% of testbed iteration time for the in-house Hunyuan dense models, with honesty about the weak spot: MoE models forecast worse, because expert routing is data-dependent and some operators remain uncalibrated.
Two case studies show the tool earning its keep. Asked which parallelism should cross datacenter boundaries when GPU supply forces multi-site training, Seer contradicts the folk answer (pipeline parallelism, because its point-to-point traffic is lightest): data-parallel traffic, though bulkier, is infrequent and overlaps well, and beats PP in several configurations, while ZeRO-style sharded DP is always the wrong thing to stretch across a link; efficiency holds until the cross-site bandwidth oversubscription passes roughly 16:1. Asked how large an intra-host domain is worth building, Seer quantifies what the scale-up debate usually argues qualitatively: MoE training and inference gain substantially from a larger NVSwitch domain, dense models much less.
What we take from it
Read against InfiniteHBD[7], which appeared at the same SIGCOMM, Astral marks the other pole of the design space: one paper shrinks the switch into a transceiver to build cheap specialized rings, the other builds the most uniform, switch-heavy fabric money can buy so that a rental fleet has no bad corners. Note that the two are answers to different businesses as much as different workloads, and Astral’s insistence on identical bandwidth at every tier only pays off if your tenants’ jobs fragment unpredictably, which is precisely the condition of a cloud. The monitoring half of the paper pairs naturally with ByteRobust: ByteDance optimizes what happens after a fault is suspected (evict fast, diagnose offline), Tencent optimizes the suspicion itself (join every layer’s telemetry until the fault has a street address), and a complete operation plainly needs both. We believe the underrated contribution is Seer, not for its modeling, which is deliberately simple, but for its position in the loop: the same calibrated forecast sets the anomaly thresholds for monitoring, prices the cross-datacenter bandwidth question, and sizes the next intra-host domain. The caveats are the usual ones for operator papers: every number is self-reported from one fleet, the 512K figure is design capacity while 128K GPUs are deployed, and the same-rail bet leans on collective libraries continuing to keep traffic rail-local. What the paper documents beyond dispute is that a company denied the FLOPS race can still compete in the systems race, and that doing so takes a co-designed stack reaching from the hash function in a switch ASIC down to the direction the cooling air blows.
Source and attribution
This article is an editorial summary prepared for Silicon & Systems. It restates the argument of the paper cited below in our own words. No text, figures or tables from the paper are reproduced here, and the figures on this page were created for this summary. The paper appeared at SIGCOMM 2025; the authoritative version is in the Proceedings of the ACM SIGCOMM 2025 Conference, (c) 2025 the authors, publication rights licensed to ACM.