Pretraining a frontier model is a months-long bet that tens of thousands of GPUs will mostly keep moving, and the hardware votes against it every few hours. Meta’s Llama 3 run saw a hardware failure roughly once every 2.78 hours on 16,000 H100s[3], and the standard response (stop, read logs, stress-test, reschedule, reload a multi-terabyte checkpoint from remote storage) burns hours per incident. A SOSP 2025 paper from ByteDance Seed and the University of Hong Kong describes ByteRobust[1], the management layer that has run ByteDance’s production LLM training for over a year, and states its result in the currency that matters: effective training time ratio (ETTR), the fraction of wall-clock time spent making forward progress. For a three-month pretraining job on 9,600 Hopper GPUs, ByteRobust held cumulative ETTR at 97%, with no single unproductive stretch longer than 50 minutes.
We restate the paper’s argument in our own words below. Its interest lies less in any single mechanism than in a reversal of instinct: at this scale, finding out exactly what broke is a luxury, and the system is engineered around not needing to know.
The ledger: what actually breaks
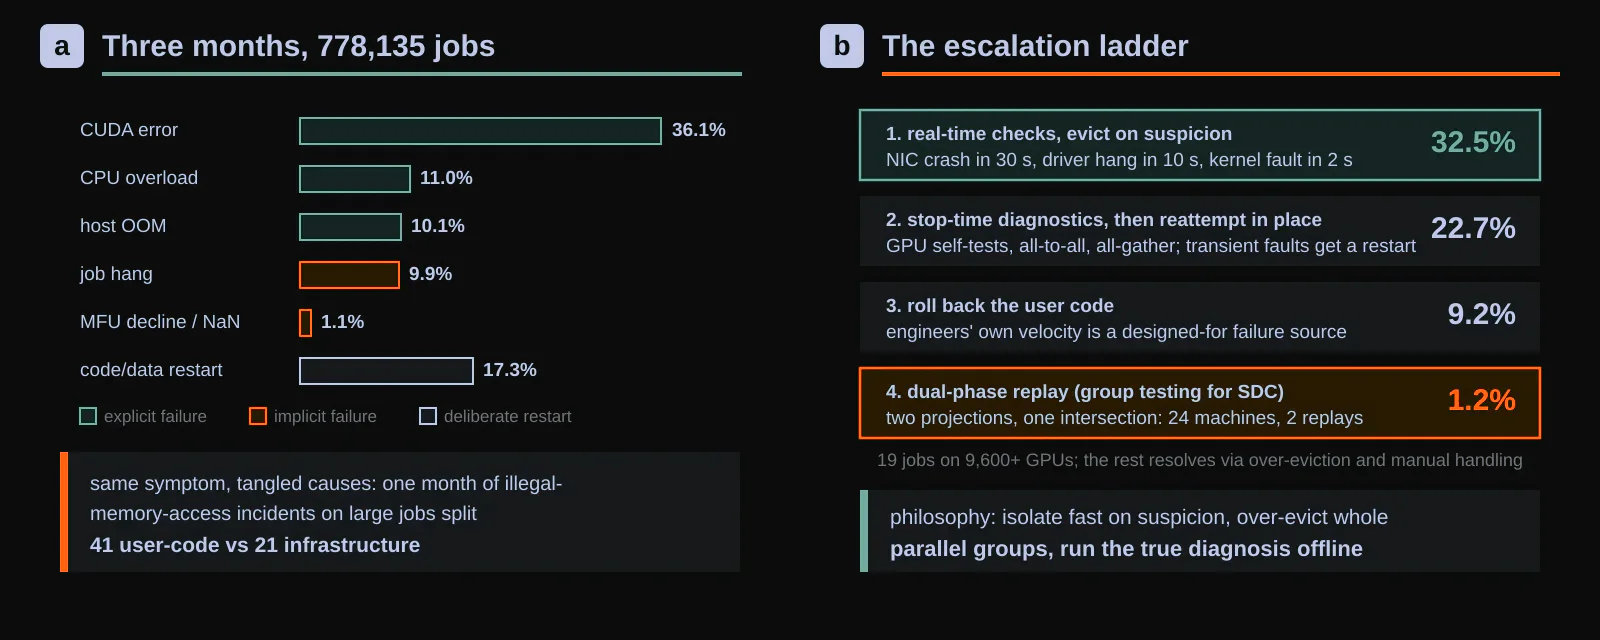
The paper opens with a census that most operators keep private. Over three months and 778,135 training jobs on the production platform, ByteRobust classified 38,236 explicit failures, meaning incidents with a legible error message or exit code, and 5,948 implicit ones, which announce themselves only as a job that stops progressing or a loss curve gone wrong. CUDA errors dominate the explicit column at 36.1%, followed by CPU overload at 11.0% and host out-of-memory at 10.1%; job hangs dominate the implicit column at 9.9% of all incidents. A third category is the tell: 17.3% of incidents are deliberate restarts, engineers interrupting a running job to adjust data mixtures, integrate fused kernels, or tune parallelism. LLM pretraining behaves like a scientific experiment whose apparatus is rebuilt mid-flight, and any reliability design that treats the workload as frozen code misses a sixth of the interruptions before it starts.
The census also explains why root-cause analysis at incident time is a trap. Identical symptoms trace to disjoint causes: among large-job incidents in one month, illegal memory access came from user code 41 times and from infrastructure 21 times, so neither a code rollback nor a machine swap is a safe reflex. Implicit failures are worse. A hung collective produces no logs until the NCCL timeout fires 30 to 60 minutes later[2], an MFU decline drags every per-machine metric down in lockstep, and silent data corruption[7] spreads through collective communication, so one GPU computing wrong numbers contaminates the global gradient and the visible NaN appears far from its source. Specifically, the authors report that NVIDIA’s field diagnostic reaches only 70% recall on the SDC machines they later confirmed, which is to say that the best available tool misses nearly a third of the culprits.
An escalation ladder that prefers eviction
ByteRobust’s stated philosophy is rapid isolation over precise localization: GPU-hours are the scarce resource, so the system would rather evict a machine on suspicion than idle a cluster on proof. The architecture splits into a control plane (a controller orchestrating detection and recovery, plus an analyzer for runtime evidence) and a per-pod data plane (a monitoring, diagnosis, tracing and checkpointing agent), and incidents climb an escalation ladder whose cheap rungs handle almost everything.
The bottom rung is real-time checking. Lightweight inspection threads poll network, GPU and host health at second-level intervals without touching the GPUs, and the numbers justify the plumbing: a NIC crash is caught in 30 seconds and a GPU driver hang in 10, against the roughly ten-minute distributed timeout a log-watching system waits for, and an OS kernel fault surfaces in 2 seconds. High-confidence signals (a lost GPU, a dead disk) trigger immediate eviction with no further diagnosis. When training stops without a clear culprit, the second rung runs stop-time diagnostics, a fixed sequence of GPU self-tests, intra-machine all-to-all and inter-machine all-gather checks that either names a machine or clears the hardware. If everything passes, the third rung simply restarts in place, on the theory that transient link flaps deserve a shrug rather than an investigation. The fourth rung is the unusual one: ByteRobust treats the engineers’ own velocity as a failure source, so if a restart fails again it rolls the user code back to the last stable version and retries, converting “was it the new kernel or a bad machine” from a debugging session into an automated experiment. Across 19 production jobs on 9,600 or more GPUs, these four rungs resolved 32.52%, 22.70% and 9.20% of failures respectively (eviction, reattempt, rollback), leaving 1.23% for the top.
The top rung handles the cases that defeat every test: suspected SDC that no diagnostic reproduces. ByteRobust falls back on group testing. It replays a shortened version of the job twice, once with machines partitioned into contiguous groups and once with a strided partition, keeping tensor- and pipeline-parallel sizes fixed so the communication pattern stays faithful and only the data-parallel width shrinks. A group that reproduces the fault in each phase yields two coordinates, and their intersection pins the faulty machine, 24 machines resolved in two replays rather than a binary search’s five. This is because SDC incidents in their fleet almost always involve exactly one machine, so two well-chosen projections suffice.
Reading stack traces instead of logs
For hangs and slowdowns, ByteRobust’s analyzer skips logs entirely and captures Python and native stack traces from every training process on demand, including the data-loader and checkpoint subprocesses where root causes often hide. The aggregation is three steps: parse each pod’s process tree, cluster the collected stacks by string equality, and declare the dominant clusters healthy. Whatever remains is an outlier, and the system evicts the smallest parallel group (typically a pipeline group) that covers all outliers. Note that this is deliberate over-eviction: a PP group in a 9,600-GPU job spans 8 machines of which perhaps one or two are faulty, and the authors accept 6 to 7 false positives per incident as the price of restarting in minutes. For fail-slow cases the aggregation repeats every 10 seconds, and the parallel group flagged most often across 5 rounds is declared the degrader. A case study shows the payoff and the honesty: an evaluation-phase hang was isolated to one 6-machine pipeline and evicted automatically, while the actual root cause (two machines with defective CUDA cores) emerged only after days of background stress testing that no running job had to wait for.
Recovery as a first-class mechanism
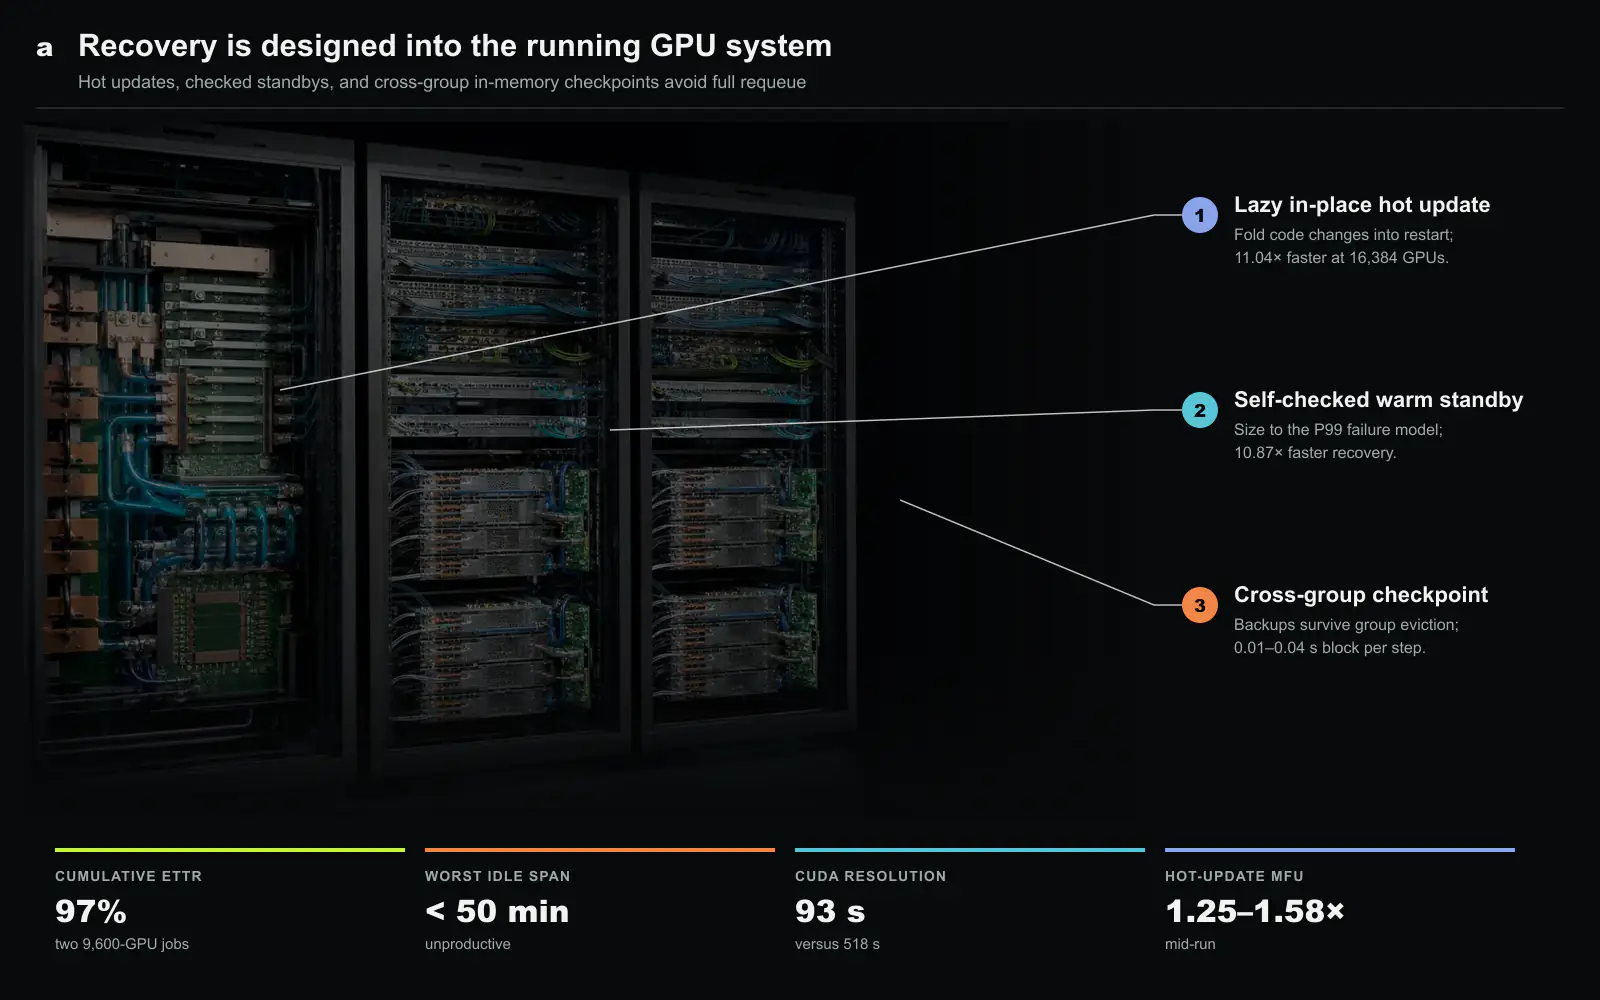
Detection would be worthless if every fix cost a full reschedule, so the recovery side gets equal engineering. In-place hot updates apply code changes without tearing down pods, and lazily: urgent fixes interrupt training immediately, while routine upgrades wait and piggyback on the next failure-induced restart, exploiting the grim arithmetic that an interruption arrives every few hours anyway, with a 24-hour deadline as backstop. Warm standby machines are pre-provisioned, self-checked and parked in low-power sleep, sized by a binomial model of simultaneous failures at the 99th percentile (4 spare machines suffice for a 1,024-machine job). Checkpointing goes in-memory and every-step: shards are copied device-to-host on a dedicated CUDA stream, double-buffered, and backed up to peer machines chosen outside the rank’s own tensor-, pipeline- and data-parallel groups, precisely so that an over-eviction of a whole parallel group can never take a checkpoint down with its owner. Measured on jobs up to 16,384 GPUs, hot updates resume training 11.04× faster than a full requeue (65 versus 768 seconds at the largest scale), warm standbys cut mean rescheduling time by 10.87× and land within 5.19% of an oracle with unlimited spares, and every-iteration checkpointing blocks training for 0.01 to 0.04 seconds per step, retaining over 99% of no-checkpoint MFU while the Megatron-LM baseline retains about 40%.
What the deployment shows
The headline deployment covers two production pretraining runs on a 9,600-GPU Hopper cluster: a dense model above 70B trained for three months and a mixture-of-experts model above 200B for one month. Both jobs held cumulative ETTR near the 97% plateau, and a sliding one-hour window shows the texture: ETTR dips cluster late in each run, when a newly deployed long-context feature introduced code failures and the aging cluster degraded more often, yet recovery stayed fast enough that the cumulative curve barely moved. Resolution-time comparisons against selective stress testing, the prior standard practice[4][6], show an 84.50% cut in mean time for CUDA errors (93 versus 518 seconds), and categories that stress tests cannot localize at all, such as failures introduced by human code changes, fall to the rollback mechanism in about a minute. Meanwhile the MFU of the two jobs rose 1.25× and 1.58× over their lifetimes, each step up the curve a hot-updated optimization that cost almost no ETTR to deploy. The paper’s candor extends to its own tooling: one incident of degraded MFU was eventually traced to the diagnostic suite itself, which had silently lifted a GPU frequency lock during an earlier check.
What we take from it
Read alongside the other systems in this series, ByteRobust completes a picture of ByteDance’s training stack: HybridFlow[8] organizes what the GPUs compute (its lead author reappears on this paper), and ByteRobust decides whether they get to keep computing at all. The philosophical kinship with Aegaeon, which shared the same SOSP session, is also striking: both papers profit from abandoning a unit of granularity everyone assumed (the request there, the root cause here). We believe the durable contribution is the reframing of reliability as a throughput problem. Every mechanism in the paper (over-eviction, lazy updates, cross-group backups, group-testing replay) spends a cheap resource, spare machines and redundant state, to conserve the expensive one, cluster-hours, and pushes true diagnosis into the background where it costs nothing. The 97% figure should still be read with its context: it describes a mature system with a standing army of engineers behind it, on jobs whose failure statistics fed the very models that size its standby pools. What generalizes is the accounting identity the paper operationalizes: at 10,000 GPUs, ETTR is the product of failure frequency, detection latency and recovery cost, and of those three only the first is beyond software’s reach.
Reliability capacity needs its own budget
Warm standbys, cross-group checkpoint copies, diagnostic workers, and over-evicted healthy machines all consume capacity. They should not be hidden outside the training utilization report. An operator should state the installed GPUs, GPUs assigned to the job, spares held ready, devices removed for diagnosis, and useful accelerator-hours delivered after every recovery cost. This denominator makes a 97% ETTR comparable with a system that reserves fewer spares but recovers more slowly.
The reserve should also adapt to evidence. A binomial model based on recent failure behavior is a starting point, but correlated rack, network, firmware, or cooling events violate independent-failure assumptions. The platform should compare predicted simultaneous failures with observed tails and raise the reserve or widen failure domains when the model underestimates them. Otherwise, a standby policy calibrated on ordinary device faults can disappear exactly when a shared incident affects the most machines.
Finally, over-eviction requires a customer-visible rule. Removing an entire parallel group is rational when minutes of lost work cost more than several healthy machines, but the threshold changes with checkpoint age, job priority, and spare scarcity. ByteRobust’s method becomes portable when these quantities are explicit. The lesson is not to evict aggressively in every cluster. It is to price diagnosis delay against recoverable progress and make the cheapest safe action automatic.
Source and attribution
This article is an editorial summary prepared for Silicon & Systems. It restates the argument of the paper cited below in our own words. No text, figures or tables from the paper are reproduced here, and the figures on this page were created for this summary. The paper appeared at SOSP 2025 and is distributed under a Creative Commons Attribution 4.0 International license; the version of record is in the Proceedings of the 31st ACM Symposium on Operating Systems Principles, (c) 2025 the authors.