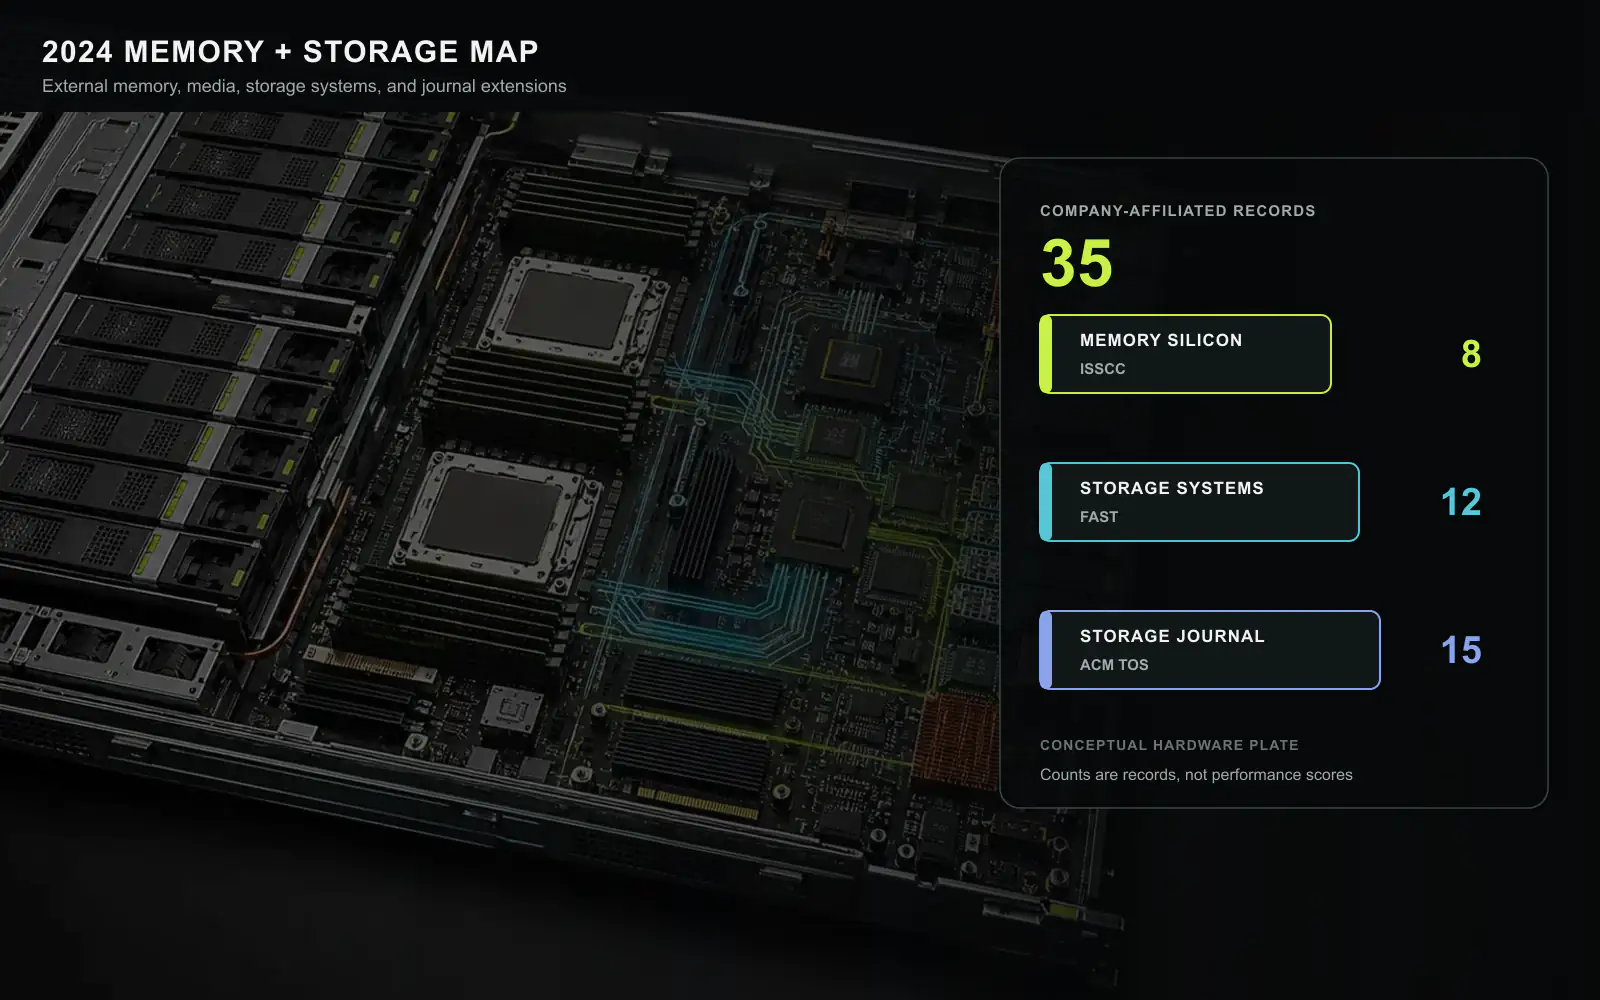
In 2024, memory and storage stopped behaving like separate components. Eight company papers in the main ISSCC external-memory session pushed DRAM and NAND density, pin rate, and stacked bandwidth. Twelve company-affiliated FAST papers then showed why those device gains were not enough. Page faults, cache admission, filesystem mode, replication, fragmentation, and cloud-block-store operations could still dominate the useful result. Fifteen ACM Transactions on Storage records extended the same argument into CXL memory, SSD compression, deduplication, RAID, and persistent indexing.
This review indexes all 35 records in that declared scope. It does not count processor-local SRAM, compute-in-memory macros, tutorials, keynotes, panels, or papers without a company affiliation. Those circuit categories are covered by our separate annual circuit index. Conference papers are assigned by event year and journal papers by first publication year. A company affiliation means at least one author listed a commercial organization on the published record. University-only papers are excluded even when the topic is relevant.
HBM made package geometry part of memory performance
The 2024 ISSCC memory session placed three different scaling problems next to one another. SK hynix reported a 48 GB, 16-high HBM3E stack at 1,280 GB/s. Its all-around power TSV and six-phase read-data-strobe scheme did not merely raise a headline bandwidth. They addressed the power-delivery and TSV-area costs that appear when more dies and more channels occupy the same package boundary.[1]
Samsung’s 32 Gb DDR5 used a symmetric-mosaic architecture at 8.0 Gb/s per pin, while SK hynix’s LPDDR5 Turbo reached 10.5 Gb/s per pin at 1.05 V. These results approached bandwidth from different system constraints. DDR5 serves replaceable modules and broad capacity. LPDDR must protect energy and signal margin over a compact mobile channel. HBM spreads traffic across a wide interface but pays in stacking, testing, heat, and package complexity. Comparing only per-pin rates would erase the design problem each product actually solved.
GDDR7 provided another answer. SK hynix reported 35.4 Gb/s per pin and Samsung 37 Gb/s, both using PAM3 signaling. Three voltage levels carry more information per transition than binary NRZ, but they also shrink decision margins and make clocking, equalization, calibration, and crosstalk control part of the memory device. A separate Samsung 4 nm transceiver reached 48 Gb/s per wire for future memory and chiplet links. The common direction was clear: an external-memory interface increasingly contains active correction rather than relying on a clean board channel.
NAND density became useful only with parallel I/O and policy
Samsung’s 280-layer 1 Tb QLC NAND reported 28.5 Gb/mm² and a 3.2 GB/s interface, while Micron’s 1 Tb TLC design reported 300 MB/s write throughput. Density, interface speed, and program rate describe different parts of a flash device. A denser array can lower cost per bit while increasing the amount of data affected by a plane, block, or die event. A faster interface cannot compensate for program latency or garbage collection. The published numbers therefore need a controller and workload boundary before they become a product comparison.[1]
FAST supplied that boundary. Samsung’s fragmentation study showed that modern flash does not make file layout irrelevant. Device-internal parallelism and filesystem allocation can still interact badly. NetApp’s ONTAP account described the opposite direction: a mature storage stack had to evolve when SSD latency became low enough for old software assumptions to dominate. The media improved, then the system had to remove work that had previously been hidden behind the disk.
Memory expansion moved the page-fault boundary
Huawei and Tsinghua’s TeRM extended RDMA-attached memory with SSD while removing RNIC and CPU page faults from the critical path. Huawei’s heterogeneous-memory filesystem work coordinated a DRAM cache with virtual-memory management. The two designs targeted different software surfaces, but both treated capacity as a placement problem. An extra tier helps only when translation, fault handling, eviction, and network work do not consume its benefit.[2]
The journal record made this more explicit. A memory-disaggregated radix tree with Huawei Cloud and a CXL memory-disaggregation study with Panmnesia placed indexes across remote capacity. The important denominator was not the capacity of a device. It was the number of dependent accesses, the path length of each miss, and the degree to which software could overlap or avoid them. This is also why the Panmnesia-affiliated record carries an editorial conflict disclosure: Silicon & Systems operator Myoungsoo Jung is Panmnesia’s CEO and a coauthor in the wider CXL research program.
The host and device began sharing cache policy
OmniCache combined host and near-storage caches and selected where processing should run. Baleen used learned admission and prefetching for flash caches. One pushed policy toward a device accelerator; the other tried to avoid filling a flash cache with objects that would not repay their write and lookup cost. Both papers rejected a simple rule that the closest or largest cache is automatically best.[2]
Cache placement has at least four prices: lookup latency, movement bandwidth, write amplification, and eviction regret. Device-side compute can reduce host traffic but may operate with less context. A flash cache adds capacity but consumes endurance. An ML policy can detect patterns but can also fail under a changed workload. The 2024 papers were useful because they measured policies inside complete paths rather than reporting an isolated lookup primitive.
Filesystems reopened decisions that hardware had made ambiguous
Data Direct Networks and Whamcloud dynamically switched between buffered and direct I/O inside Lustre. Samsung and Meta’s I/O Passthru work upstreamed a more flexible Linux I/O path. These projects addressed a recurring failure of storage APIs: applications are asked to choose a mode before they can know contention, cache pressure, device latency, or filesystem state.[2]
The journal papers broadened the same issue. Samsung-affiliated work placed a B+ tree over nonvolatile memory in an LSM design. Huawei collaborators added deduplication to F2FS. SmartX collaborators studied on-chip DMA for NVM storage. Seagate and ParTec revisited inline compression and deduplication when HDDs, not SSDs, remained the primary medium. None can be reduced to a faster device. Each changes where the operating system maintains ordering, metadata, or redundancy.
Reliability shifted from replication to state exploration
VMware Research’s IONIA targeted replication for modern disk-based key-value stores. Nimble Research joined Metis, a filesystem model checker that explores inputs and states. Dell’s IDEA reconsidered how a deduplication index should represent physical and logical identity. These works sit at different layers, yet all address a common question: which state must survive a failure, and how can the system prove that it preserved the right one?[2]
Cloud systems make the question harder. Alibaba’s EBS paper reported the evolution of a production block store, while Alibaba, IBM, China Mobile, Tencent, PingCAP, and other companies appeared in journal work on block images, log storage, RAID, container deduplication, and latency contracts. At this scale, the correctness boundary includes rollout, repair, tenant isolation, background work, and operational observability. A device error rate or a replication factor alone cannot describe it.
What changed for system buyers
The 35-paper record suggests four checks for any memory or storage claim.
First, identify the measured boundary. HBM stack bandwidth, NAND interface rate, filesystem throughput, cache hit rate, and cloud-service latency are not interchangeable. The hardware and software included in a measurement must travel with the number.
Second, identify the movement avoided. A design may add capacity yet create remote faults, metadata traffic, or write amplification. The strongest 2024 systems reduced a specific crossing between CPU, RNIC, DRAM, controller, flash, or replica.
Third, identify the failure domain. More tiers introduce more partial failures and recovery states. Model checking, authenticated indexes, replication, and data reduction must be judged by the state they preserve, not only steady-state throughput.
Lastly, identify the lifetime. HBM and LPDDR optimize active data paths, flash caches consume endurance, cloud archives optimize years of retention, and block stores must survive continuous migration. One hierarchy cannot optimize all four without policy.
Device bandwidth and application bandwidth separated
The 2024 device papers made bandwidth look abundant, but the system papers showed why an application can still wait. HBM3E’s 1,280 GB/s is produced by many channels operating in parallel. A workload with dependent pointer traversal, a small batch, or poor address distribution may not generate enough concurrency to occupy them. LPDDR and DDR5 can offer lower aggregate bandwidth but may deliver a better energy-capacity point when the processor does not need the HBM interface every cycle.
Storage has the same distinction. A 3.2 GB/s NAND interface does not mean a filesystem can sustain 3.2 GB/s of application writes. Data must be programmed into cells, translated through an FTL, protected with error-correcting codes, placed into blocks, and later reclaimed. Filesystem metadata and durability ordering can force serialized operations even when the media has unused parallelism. The correct comparison therefore has at least three levels: media capability, device-level sustained behavior, and application-visible service.
This distinction changes procurement. A buyer should ask for the bandwidth distribution under the intended queue depth, read-write mix, request size, and capacity utilization. The answer should include tail latency and the duration of the run. Short bursts can consume empty buffers or fresh blocks and hide the steady-state cost. HBM can similarly look ideal during a dense kernel while model loading, synchronization, or capacity misses dominate the complete job.
Capacity expansion needs a miss-cost ledger
TeRM, heterogeneous-memory filesystems, CXL indexing, and disaggregated trees all add capacity beyond local DRAM. Their common accounting problem is the miss-cost ledger. A local hit pays translation and cache lookup. A remote-memory hit adds fabric traversal and remote-controller service. An SSD-backed miss can add page selection, queueing, flash translation, and media access. If the software discovers the tier only after a blocking fault, the latency is exposed directly to the application.
The useful metrics are therefore not only hit rate and average latency. They include the fraction of misses on the critical path, the number of simultaneous misses the system can sustain, bytes moved per useful byte, CPU time spent in fault and eviction work, RNIC occupancy, and the amount of local DRAM reserved for metadata. A design can improve average latency while worsening a dependency-heavy tail. It can increase nominal capacity while reducing the memory available to the application through metadata and pinned buffers.
Placement also needs a stability test. A hot set that moves faster than the controller can learn creates oscillation. Pages can be promoted and evicted repeatedly, consuming fabric and device writes without increasing useful hits. Strong evaluations show warmup, phase changes, and the cost of wrong decisions. The 2024 papers started exposing these costs, but product deployment requires longer traces and explicit control over hysteresis.
Data reduction changed the meaning of a write
Deduplication, compression, delta encoding, and thin block images appeared repeatedly across the 2024 journal record. These techniques reduce physical bytes, but they make a logical write depend on shared indexes and previous data. One 4 KB application write may update a fingerprint table, reference counts, a compression dictionary, a mapping structure, and a recovery log before it becomes durable. The media sees a different operation from the application.
This is why a reduction ratio cannot stand alone. A useful result reports index-memory cost, lookup and verification work, collision handling, metadata amplification, recovery time, and the effect of incompressible or already encrypted data. Encrypted-data reduction and authenticated indexes add another condition: the storage service must not learn or corrupt more than the security model permits. A large space saving that creates an unbounded rebuild window is not operationally cheaper.
The HDD-focused VDO paper is especially instructive. Techniques often associated with expensive flash can matter on disks when capacity cost dominates and sequential access can absorb metadata work. Conversely, an ultra-fast SSD can make a CPU-heavy reduction pipeline the bottleneck. Data reduction is therefore a placement decision for computation and metadata, not a property of one medium.
Production storage measured transitions, not static points
Alibaba’s EBS history and NetApp’s ONTAP evolution differ from a clean-slate prototype. Production systems cannot replace every interface or data layout at once. They must migrate tenants, preserve snapshots, handle mixed hardware generations, and roll back software while requests continue. The important engineering object is the transition path.
A transition has at least four states: old-only, dual-read or dual-write, new-preferred, and old-state retirement. Each state creates different consistency and capacity costs. Replication can protect data while still allowing two versions of metadata to disagree. Background migration can preserve correctness while consuming the I/O budget needed by foreground traffic. Observability must identify which version or path served a request so operators can separate hardware latency from rollout behavior.
FAST papers that upstreamed Linux paths or modified Lustre also faced an ecosystem transition. A new API is useful only if existing applications remain correct and administrators can diagnose the choice it made. Dynamic buffered/direct I/O switching should reveal why it selected a mode. I/O Passthru should preserve a conventional path when the optimized path is unavailable. These requirements often determine adoption more than the peak benchmark.
Reliability evidence needs time and population
Model checking and replication reason about different evidence. Model checking explores possible state transitions under an explicit model. Replication observes failures in a deployed configuration. Neither automatically proves field reliability. The model can omit a device behavior, and a deployment can run too briefly to expose a rare correlated failure.
For memory and storage, population matters. A bit error rate measured on one condition, an SSD failure model trained on one fleet, or a recovery test on a small cluster may not transfer across process, firmware, workload, temperature, and age. A credible claim reports the unit population, test duration, injected failures, confidence interval where available, and exclusions. It also distinguishes detected, corrected, contained, and recovered failures.
This is particularly important when more logic moves into devices. A near-storage accelerator, smart controller, or learned cache adds firmware and state that can fail independently of the media. The recovery plan must specify whether that state is reconstructible from authoritative data. Otherwise, an optimization that reduces normal-path movement can enlarge the failure domain.
How this inventory should be used
The list is a map of public evidence, not a purchase shortlist. ISSCC establishes measured circuit and memory-device points under the conditions reported by each paper. FAST evaluates storage-system mechanisms and prototypes, sometimes with production traces. ACM TOS includes both extended systems work and studies with different levels of deployment evidence. Venue labels describe review communities; they do not make unlike measurements comparable.
Readers can use the map in three passes. First, select the physical tier that constrains the workload: stacked DRAM, module DRAM, remote memory, flash, disk, or a cloud service. Second, locate the software mechanism that determines access to that tier: fault handling, cache admission, filesystem mode, indexing, replication, or data reduction. Third, verify that the cited evaluation crosses both layers. A device metric without the software path and a system metric without the media condition each leave a large uncertainty.
The annual index also makes absence visible. In 2024, the public company record contained many mechanisms for adding or managing tiers but less evidence about multi-year calibration drift, mixed-vendor CXL operation, and application-visible HBM fault containment. Those are not claims that the technologies fail. They are the next questions a system owner should ask before converting promising measurements into a fleet assumption.
A practical comparison worksheet
The inventory becomes more useful when every candidate is reduced to the same worksheet. Start with the workload unit: a model token, database transaction, recovered object, indexed vector, container start, or retained terabyte-year. Then record the hardware boundary, software boundary, capacity used, data moved, energy, latency distribution, and failure behavior for that unit. This prevents a high media number from being compared with a lower but application-complete result.
Next, write down the baseline’s hidden advantages. A DRAM-only system may use more expensive capacity but avoid remote-fault software. A conventional block device may omit device compute but inherit mature recovery tooling. An HDD archive may be slower but have a known replacement and migration process. The proposed system should beat the real alternative after those properties are included, not a stripped-down baseline.
Lastly, separate a measured value from an estimated value and a structural limit. ISSCC silicon numbers are measured under stated conditions. A system paper may measure throughput but estimate fleet cost. An interface width multiplied by pin rate is a structural peak, not delivered traffic. Putting all three in one column produces false precision.
For 2024, this worksheet highlights the central trade. More bandwidth and capacity were available, but useful work depended on avoiding or managing crossings. The strongest candidate is not automatically HBM, LPDDR, CXL memory, or flash. It is the hierarchy that minimizes total movement and recovery cost for the declared workload while leaving enough telemetry to prove the result in operation.
The worksheet should be repeated at more than one scale. A single server can show media and software effects, but it cannot expose repair traffic, tenant interference, or correlated component behavior across a fleet. A fleet average can show economics while hiding a small class of workloads with unacceptable latency. Results should therefore include a controlled component experiment, an end-to-end application run, and a population view where the evidence exists.
Cost needs the same discipline. Purchase price, installed capacity, usable capacity after redundancy, power, cooling, host memory reserved for metadata, network ports, and operator time belong in one denominator. A tier that looks inexpensive per raw byte can be costly per available byte or recovered byte. Conversely, an expensive HBM stack can be economical when it removes enough processors, networking, or stalled accelerator time from a fixed service objective.
No 2024 paper covers every cell of this worksheet. That is expected. The purpose is to connect compatible evidence without pretending the papers ran one common benchmark. A deployment decision can use ISSCC to bound device capability, FAST to understand mechanisms, and TOS to inspect longer designs. It still needs a local workload trace and fault exercise before the result becomes an operating assumption.
Complete 2024 company-paper index
The compact inventory below is the publication record, not a ranking. Paper pages carry the complete author lists.
ISSCC external memory, 8 records
- 13.1, 35.4 Gb/s/pin 16 Gb GDDR7 with PAM3, SK hynix.
- 13.2, 32 Gb 8.0 Gb/s/pin DDR5 with symmetric-mosaic architecture, Samsung Electronics.
- 13.3, 280-layer 1 Tb QLC 3D NAND at 28.5 Gb/mm² and 3.2 GB/s I/O, Samsung Electronics.
- 13.4, 48 GB 16-high 1,280 GB/s HBM3E, SK hynix.
- 13.6, 16 Gb 37 Gb/s GDDR7 with PAM3-optimized equalization, Samsung Electronics.
- 13.7, 1 Tb TLC 3D NAND with 300 MB/s write throughput, Micron Technology.
- 13.8, 16 Gb 10.5 Gb/s/pin LPDDR5 Turbo, SK hynix.
- 13.10, 4 nm 48 Gb/s/wire memory and chiplet transceiver, Samsung Electronics.[1]
FAST storage systems, 12 records
- TeRM, Huawei Technologies and Tsinghua University.
- Combining Buffered I/O and Direct I/O in Distributed File Systems, Data Direct Networks, Whamcloud, and collaborators.
- OmniCache, Samsung, Igalia, and Rutgers.
- Optimizing File Systems on Heterogeneous Memory, Huawei Technologies and collaborators.
- I/O Passthru, Samsung Semiconductor and Meta.
- Metis, Nimble Research and university collaborators.
- I/O in a Flash, NetApp.
- We Ain’t Afraid of No File Fragmentation, Samsung Electronics and university collaborators.
- IONIA, VMware Research and university collaborators.
- Physical vs. Logical Indexing with IDEA, Dell Technologies and university collaborators.
- What’s the Story in EBS Glory, Alibaba Group.
- Baleen, Meta, Microsoft, and university collaborators.[2]
ACM Transactions on Storage, 15 records
- Contract-aware LSM storage, PingCAP and collaborators.
- A Memory-Disaggregated Radix Tree, Huawei Cloud and collaborators.
- End-to-end deduplication for Docker registries, Alibaba and IBM Research collaborators.
- An LSM Tree Augmented with B+ Tree on Nonvolatile Memory, Samsung Electronics and Seoul National University.
- Block-level Image Service for the Cloud, Alibaba Group.
- CXL memory disaggregation for billion-scale nearest-neighbor search, Panmnesia and KAIST.
- Deduplication on F2FS, Huawei Technologies and collaborators.
- Data-pattern-aware vertical partitioning for cloud log storage, Alibaba Group and collaborators.
- Parity-based RAID with ultra-fast SSDs, China Mobile, Tencent, and collaborators.
- Extremely-Compressed SSDs, OceanBase, Ant Group, and collaborators.
- Fastmove, SmartX and university collaborators.
- From SSDs Back to HDDs, ParTec, Seagate Technology, and collaborators.
- Tarazu, IBM Research and collaborators.
- FSDedup, Hikvision and university collaborators.
- LVMT, Shanghai TreeGraph Blockchain Research Institute and collaborators.[3]
Source and copyright notice
This article is an independent editorial synthesis of official 2024 conference programs, open USENIX paper pages, and ACM publication metadata. Technical claims and measurements are paraphrased in original language. No IEEE or ACM figure, table, or publisher layout is reproduced. The body figure was created for this article from a logo-free conceptual hardware plate with deterministic labels. ISSCC papers are © IEEE 2024; ACM TOS articles are © their authors or ACM according to each record; FAST papers remain under the rights stated on their individual USENIX pages.