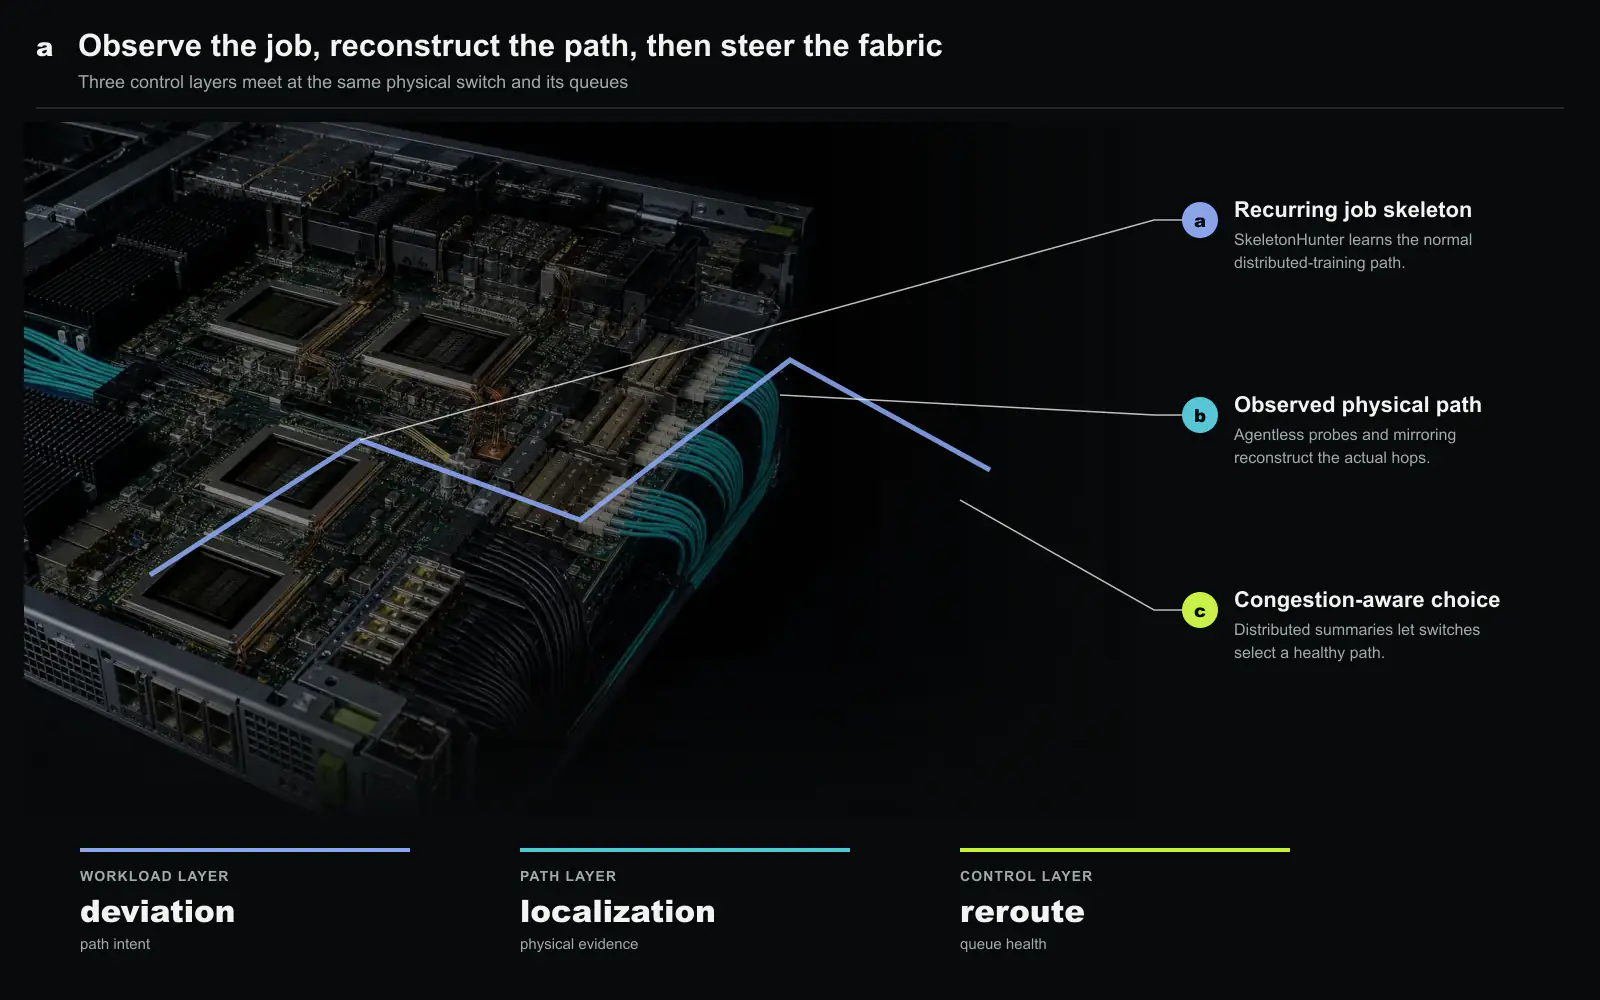
A distributed training job may use thousands of GPUs, but it does not communicate uniformly across every possible pair. Tensor, pipeline, data, and expert parallel groups repeat a small set of collective patterns. Alibaba Cloud’s SkeletonHunter turns that regularity into a production diagnostic system[1]. Instead of attempting to observe every virtual and physical path in a changing container fleet, it infers the paths that current training traffic repeatedly exercises and concentrates probes there.
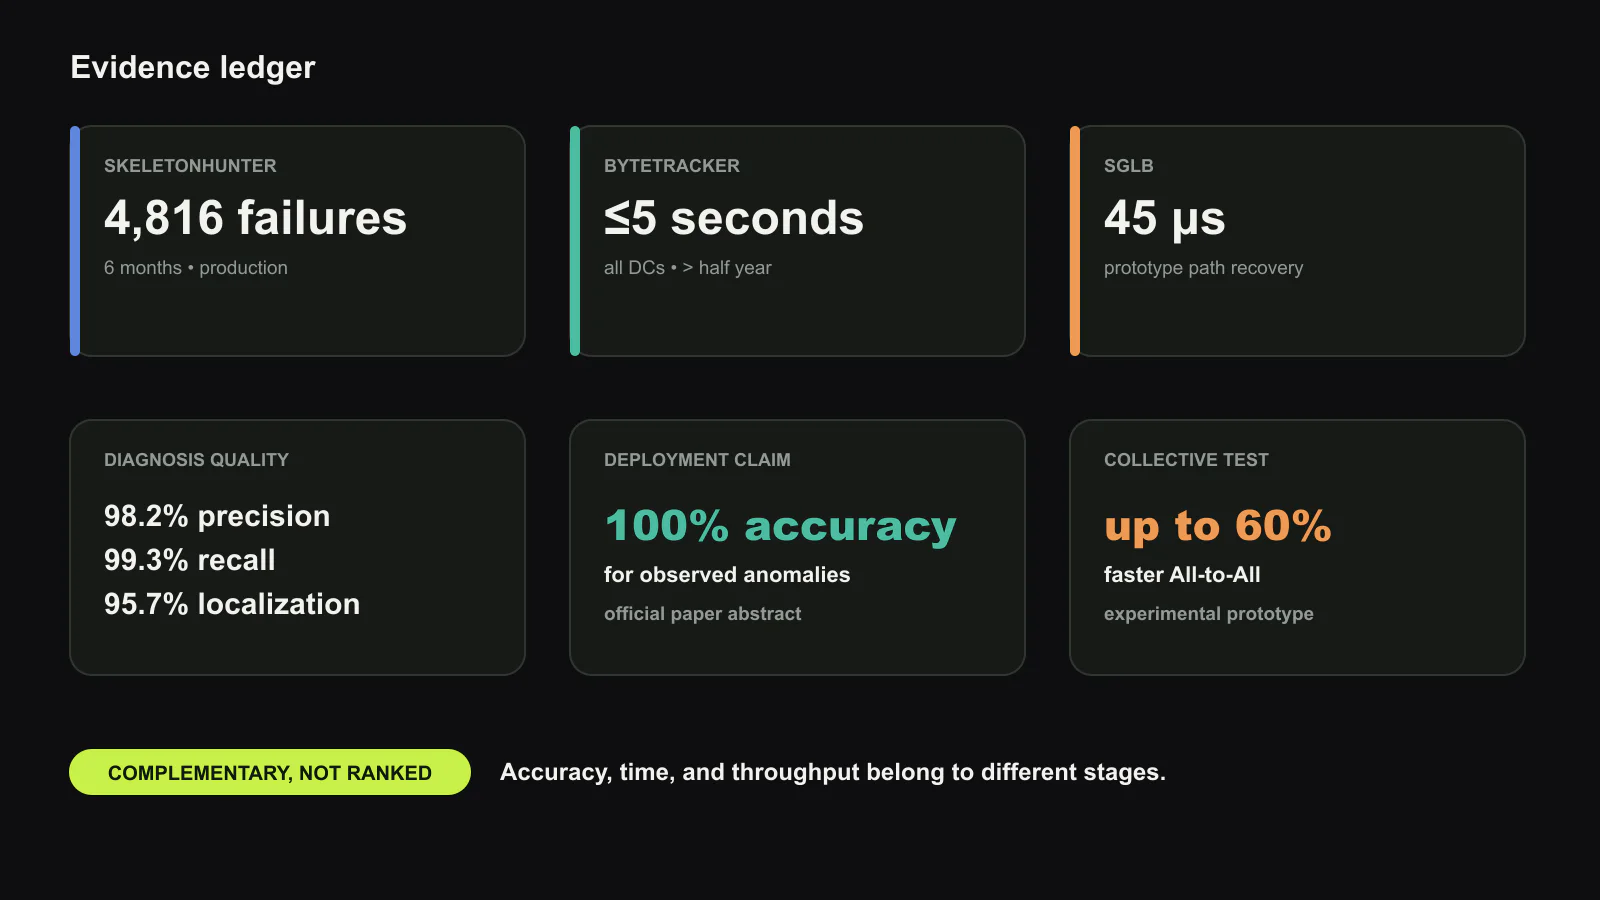
The system was evaluated in a cloud with more than 40,000 GPUs and 40,000 RDMA NICs that had served roughly five million training tasks. During a six-month production period, it raised alarms for 4,816 network failures. Reported precision was 98.2%, recall was 99.3%, and faulty-component localization reached 95.7% accuracy. Operators repaired 98% of the identified components, after which the reported monthly failure rate fell by 99.1%. These figures describe successive steps in one operating process. Detection quality did not directly create the final reduction; localization, repair, and exclusion of damaged resources connected the two.
The paper matters because it changes the unit of network observability. A conventional monitor treats links or endpoint pairs as inventory to be covered. SkeletonHunter treats the active training topology as the object to protect. That distinction reduces work by orders of magnitude, but it also makes monitoring dependent on the workload plan.
Containers multiply the search space
Containerization makes a large training service easier to allocate and isolate, while making its network harder to diagnose. More than half of the containers observed by the authors lived for less than one hour. Containers belonging to one job did not always reach the same lifecycle state at the same time. A monitor that relies on a stable endpoint map can therefore become stale within a training run.
Each container can also bind to several RDMA NICs. The endpoint is not merely a host but a container-to-NIC association selected for a parallel communication pattern. Below that endpoint sits an overlay containing virtual interfaces, virtual switches, encapsulation state, and flow-table entries. The physical fabric remains underneath. One slow collective may originate in any of these layers.
The paper expresses the resulting search problem as a product. If a task has 1,000 containers, each binds eight NICs, and every NIC exposes sixteen relevant virtual components, a full inspection reaches 128,000 components during a training round. A typical round lasts about 30 seconds. Comprehensive diagnosis cannot finish on that clock, and sampling arbitrary paths can omit the one carrying the job’s critical collective.
The performance budget is unforgiving. In the reported environment, RoCE round-trip latency is expected to remain below about 20 microseconds without packet loss. An additional 10 microseconds can reduce training speed by around 20% in the cited operating experience. A connectivity problem lasting more than four seconds may cause a collective timeout and terminate the task. Monitoring must therefore narrow the search before the application-level failure becomes visible.
Periodic bursts reveal the active graph
SkeletonHunter does not require tenants to disclose their model architecture or parallelism configuration. The provider often cannot see those details in a multi-tenant service. Instead, the system observes a behavioral signature: large parameter synchronization creates periodic bursts on the endpoints that participate in the same communication group. Repetition separates the stable training graph from incidental traffic.
The inferred traffic skeleton is the set of paths consistently traversed by those bursts. It is neither a complete topology nor a random sample. It is a workload-conditioned subgraph. Paths outside it may still carry management or unrelated tenant traffic, but paths inside it are the ones whose failure can immediately delay the current training job.
This inference solves two coverage problems at once. It follows a container when its physical placement changes, because the burst pattern identifies the active endpoints again. It also avoids assuming that every NIC attached to a container participates equally. The system can group only the associations that exhibit coordinated training traffic.
The approach depends on regularity rather than packet contents. That property lowers privacy exposure compared with inspecting every production packet. It also matches the operational goal: determine whether expected communication remains healthy, not reconstruct the tenant’s tensors. Still, timing metadata is not free of sensitivity, so access, retention, and tenant isolation remain part of a deployment policy.
A smaller probing matrix fits the training clock
After identifying active groups, SkeletonHunter constructs a probe plan that covers their important connectivity with far fewer tests than a full mesh. The reduction is measurable at scale. For 2,048 allocated RNICs, the paper reports that a full-mesh round would take about 2,034 seconds. A basic reduced list takes about 241 seconds. Adding the inferred skeleton lowers the final round to approximately 25 seconds, short enough to fit the duration of a typical training iteration.
The same trend appears at smaller scales. With 512 RNICs, the respective times are about 560, 65, and 8 seconds. At 1,024 RNICs, they are roughly 1,123, 123, and 17 seconds. The skeleton-aware step reduces the already simplified plan by about 86% to 90% in these cases. The result is important not because ping is novel, but because the workload graph makes active probing tractable.
Agents still run alongside containers, yet their measured footprint remains small. CPU use converges near 1%, and memory use is about 35 MB per container. Two midrange backend servers aggregate observations from more than 40,000 endpoints belonging to about 2,000 concurrent training tasks. The division of labor is deliberate: the endpoint records a compact signal, while centralized services perform grouping and diagnosis.
A monitoring budget should nevertheless include the tail. Average overhead can hide a container whose sidecar competes with a latency-sensitive CPU path or fails to respond. The paper identifies agent crashes as one source of false alarms. A reliability monitor is itself a distributed system, and its missing data must not be indistinguishable from a failed network.
Separate virtual and physical causes optimistically
Once a probe between two endpoints becomes abnormal, the system must locate the responsible component. SkeletonHunter examines the overlay and underlay in separate passes. Each pass temporarily assumes that the other layer is healthy. This optimistic separation is supported by an operational observation: software faults in the virtual network and hardware faults in the physical network usually do not propagate into each other as the same component failure.
The method can associate inter-host symptoms with switches or links, then use device warnings and topology to narrow the cause. It can also inspect host and virtual-network state, including RNIC firmware, port status, offload behavior, bonding, GID changes, virtual-switch rules, container runtime failures, huge-page configuration, and congestion-control settings. The paper groups the observed issues into nineteen types across six component classes.
If neither pass yields a plausible cause, SkeletonHunter inspects the RDMA NIC state joining the two layers. This step is more expensive and may require manual analysis. The escalation order is therefore economically sensible: use a cheap layer-specific explanation first, then inspect the boundary when evidence remains inconsistent.
One production case illustrates the need for that boundary. Latency between two endpoints rose from about 16 to 120 microseconds after ninety seconds, with packet loss below 0.1%. Switch queues did not show a matching congestion increase. The first overlay and underlay checks found no clear defect, so the system compared NIC flow-table state and found an inconsistency. Packets had fallen back to a slower software path after a stale flow was invalidated. Isolating the NIC restored normal measurements within roughly one minute.
This example is more instructive than a generic alarm. The symptom resembled congestion, while the empty queues contradicted that hypothesis. Joining latency, loss, queue state, flow-table state, and endpoint identity produced the explanation. A deployment needs consistent timestamps and identifiers across these telemetry sources or the optimistic decomposition cannot be tested.
The production figures form an evidence chain
SkeletonHunter’s six-month result covers 4,816 detected failures and 1,302 faulty components. Precision of 98.2% answers how often an alarm corresponded to a real failure. Recall of 99.3% uses user feedback to estimate missed failures. Localization accuracy of 95.7% asks whether the blamed component was correct. None of these percentages states how much training time the fleet recovered.
Repair adds the next link. Operators fixed 98% of the identified components in September 2024. Hardware switches and NICs whose internal implementation was unavailable to the provider accounted for much of the unresolved remainder. The 99.1% monthly failure-rate decrease was measured from October through December relative to the earlier period. It is a before-and-after operational outcome following a concentrated repair campaign, not a classifier metric.
The system’s median or average response also matters. Its reported diagnosis averages about eight seconds, shorter than the common thirty-second training round. That is still longer than an in-network protection mechanism can react. SkeletonHunter is designed to identify and remove causes, not reroute every packet within microseconds. A complete fabric can use fast forwarding control to preserve traffic while diagnosis decides which component should be quarantined.
Where the skeleton can break
The design assumes that collective communication creates persistent sparse patterns. A container group used for debugging, custom point-to-point traffic, or a new parallelism scheme may not produce the expected signature. The inferred graph can then omit a required path or grow so large that probe cost rises. The paper proposes checking whether inferred edges continue to align with observed bursts and allowing users to disable or augment monitoring for unusual workloads.
Intra-host coverage is another boundary. End-to-end network symptoms can expose some PCIe-to-NIC failures, but GPU-to-GPU and GPU-to-PCIe faults are not comprehensively covered. They require hardware-specific diagnostics. A fleet should preserve that distinction when calculating recall: network monitoring cannot claim to cover every component that makes a collective slow.
False alarms can also originate in the monitor. The system uses clock synchronization for latency measurement and expects agents to respond promptly. An agent failure can look like a broken link. Independent health checks and provenance on each observation are needed so that a missing sidecar, bad clock, and actual packet failure enter different incident states.
The traffic skeleton has a lifecycle. Placement changes, elastic membership, library updates, or a new collective algorithm can alter the active edges without a network failure. The monitor should version its skeleton with the job plan and require fresh evidence after a transition. Otherwise, normal reconfiguration becomes an alarm or, worse, the system continues watching paths the job no longer uses.
What an operator should adopt
The transferable lesson is not to install one particular ping agent. It is to make the workload graph an input to network operations. The scheduler knows container membership and placement. Communication libraries know parallel groups. Telemetry observes which endpoints actually exchange bursts. Combining these sources can define a small set of high-value paths before an incident begins.
An adoption plan should record four artifacts. First, a versioned endpoint map connects job rank, container, NIC, virtual interface, host, switch port, and physical path. Second, a confidence score indicates how completely the inferred skeleton covers current traffic. Third, a probe budget specifies the time and load allowed within one training round. Fourth, a localization trace records which layer assumptions were tested and why the final component was selected.
The service objective should follow completed work. Operators can inject link loss, port flapping, offload failure, and stale flow state, then measure detection delay, localization delay, unnecessary quarantine, and training steps lost. Precision and recall remain necessary, but the final denominator is useful training progress preserved during the event.
SkeletonHunter shows that the regularity of distributed training is not only an optimization opportunity. It is diagnostic information. The workload continually redraws the subset of the network whose health matters most. A monitor that follows that drawing can be both narrower and more complete than uniform coverage, provided it treats the skeleton as a changing, evidence-backed object rather than a permanent topology.
Source and attribution
This article is an editorial summary prepared by Silicon & Systems. It restates the paper’s mechanisms, deployment results, and limitations in our own words. No source text, tables, or publisher figures are reproduced; both figures are Silicon & Systems originals first created for the multi-paper network-operations review. The author-prepared paper uses the CC BY 4.0 reuse terms. Copyright (c) 2025 the authors. The source and license are linked from the DOI record.