A GPU can remain busy while its kernel leaves useful parallelism unused. Tensor operations, data transfers, and ordinary instructions may all execute during an attention computation, yet an unnecessary dependency can prevent the next transfer from starting early enough. The total kernel duration reveals the loss without explaining its cause.
KPerfIR addresses that diagnostic gap by putting performance instrumentation inside the compiler[1]. The OSDI 2025 paper, with contributors from UC San Diego, Meta, George Mason University, and OpenAI, connects measurements to program structure rather than treating a kernel as an opaque interval. Its contribution is an infrastructure for building tools, accompanied by a region-timing tool and an attention optimization case.
This distinction is important for infrastructure teams. A profiler does not itself create application throughput. It exposes evidence that a developer or compiler pass can use to modify execution. The resulting kernel still needs correctness tests and measurements without instrumentation before its improvement can be attributed to an actual workload.
The information lost in a kernel average
Modern kernels overlap activities instead of executing every operation sequentially. Software pipelining prepares later work while current work runs. Warp specialization assigns different roles to groups of threads, such as moving tensors and consuming them. The elapsed time depends on dependencies between these roles, not simply the sum of instruction costs.
A long wait can therefore have several causes. The data producer may be slow, the consumer may be holding a reusable buffer, or a barrier may announce availability later than necessary. Optimizing arithmetic does little when the critical dependency is a delayed load. Increasing memory throughput does little when scheduling prevents a transfer from being issued.
Instruction-level traces provide detail but can lose the association with a particular loop iteration or tensor operation. High-level timing retains that meaning but may be too coarse to explain asynchronous overlap. KPerfIR seeks to retain both by inserting profiling operations where the compiler still knows the relevant structure.
A profiling operation that survives lowering
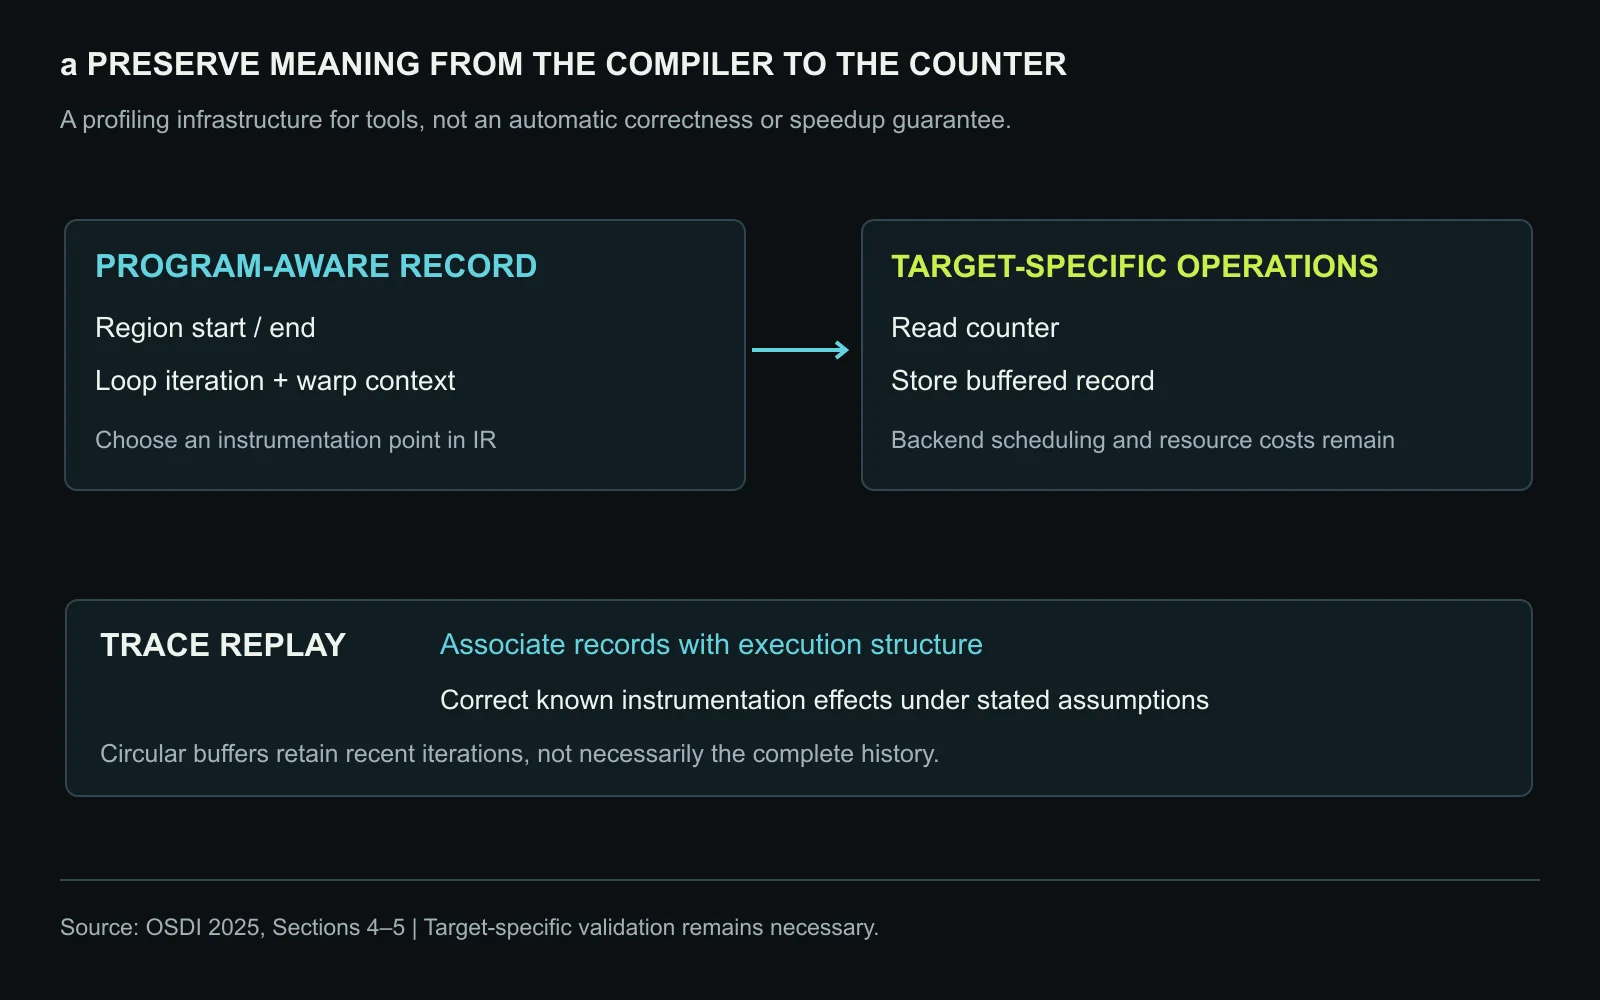
KPerfIR introduces a hierarchy of intermediate representations (IRs) rather than one hard-coded instrumentation pass. A higher-level recording operation identifies the region, event, and relevant program context. Lowering translates that intent into operations for reading counters and storing records, eventually generating instructions for a target GPU.
Separating the counter read from the record store matters. The timestamp should refer to the chosen execution point, while storing the result introduces its own instructions and resource use. Treating both as an inseparable black box would unnecessarily constrain scheduling and make it harder to reason about which part perturbs the surrounding computation.
The tool developer still has responsibilities. They choose instrumentation positions, manage profile data, and process the results. The paper exposes compiler and Python interfaces for these tasks. Its runtime can keep original and instrumented versions, allowing instrumentation to be removed after an experiment instead of becoming a permanent alteration to the application.
Portability without identical hardware behavior
The study evaluates NVIDIA H100-HBM3 and AMD MI300X systems. Its software configuration pairs LLVM 19.1 with version 3.0.0 of Triton. Supporting both backends is meaningful because a tool can express similar measurement intent without implementing a completely separate high-level analysis for each architecture. It does not make the generated instrumentation identical.
Counter instructions, thread organization, store behavior, and instruction scheduling differ. The AMD backend includes a collaborative recording strategy to avoid costly divergence around a timestamp store. Hardware identifiers help interpret the records. These are target-specific decisions beneath the shared abstraction, not details that disappear merely because the frontend is portable.
Compiler optimization is another source of interference. A recording operation can affect reordering or register use even when its own instruction count is small. Consequently, a compiler-integrated tool needs backend validation as compiler versions evolve. Reusing the interface should not be confused with reusing an old calibration indefinitely.
Recording only the portion that answers the question
Fine-grained timing creates data inside a kernel that may already consume most of its shared memory. Writing every event immediately to global memory would preserve a complete history, but the additional traffic could alter the behavior under investigation. KPerfIR’s region-timing tool instead supports a circular shared-memory buffer.
The default strategy overwrites old records when the buffer fills. It deliberately keeps recent iterations rather than promising a complete execution trace. This is useful when repeated steady-state iterations expose the overlap problem, but it can hide startup behavior or an isolated earlier stall. A trace that looks regular at the tail does not establish that the entire kernel was regular.
A flushing strategy can preserve more events at additional cost. Choosing between these modes is therefore a measurement decision. The operator should first decide whether the question concerns the steady-state loop, initialization, a rare event, or complete ordering. The cheapest record policy is only appropriate when it retains the evidence needed for that question.
The record format also uses a limited-width clock. Replay can account for wraparound under the stated interval constraints, but arbitrary long gaps cannot be reconstructed without sufficient information. The general lesson is that compact instrumentation gains efficiency by imposing assumptions that must remain visible in the analysis.
Measuring a wait changes the wait
Asynchronous operations create a particularly subtle problem. After launching work on another functional unit, the issuing thread can perform other instructions before waiting for completion. Adding timestamps during that interval consumes some of the available overlap. The observed wait may shrink even though the operation itself has not become faster.
If instrumentation consumes more slack than the original schedule had, it can create a new idle interval. Interpreting that trace literally could encourage the wrong optimization. Subtracting one average timestamp cost from the complete kernel is insufficient because the perturbation changes the relationship between concurrent activities.
The paper’s trace replay uses carefully placed records and program semantics to reconstruct the relevant intervals. For the asynchronous example, its correction assumes that the functional-unit execution can cover the inserted measurement work. This is a conditional reconstruction method, not a guarantee that instrumentation can be made invisible for every short region.
For practical use, that means checking whether the region is long enough and whether the assumed dependence structure still holds after a transformation. A tool can produce a precise-looking timeline even when its reconstruction assumptions no longer match the kernel. Visual detail is not a substitute for validating those assumptions.
The FlashAttention barrier that delayed useful work
The main optimization example examines an experimental Triton FlashAttention 3 implementation on H100. Producer warp groups load tensors while consumers perform matrix operations and softmax. Profiling shows that a barrier associated with the V tensor delays a subsequent load, extending the critical path.
The optimization advances the relevant notification and adjusts the dataflow, including preparation before the repeated loop. This permits work that previously lay on the critical path to overlap with a tensor load. The important change is not removing synchronization indiscriminately; it is identifying when the required data dependency has actually been satisfied.
KPerfIR also supports a performance-modeling pass that combines measured stage information with an overlap model. Such a model can guide which arrangement to try, but its predicted throughput is not an additional measured benchmark. The paper simplifies initialization and completion effects when modeling the overlapping stages, so model agreement should be checked for the intended problem sizes.
This example illustrates a productive division of work. The compiler supplies structure, profiling identifies the runtime dependency, and a targeted transformation changes the schedule. Neither a utilization percentage nor a standalone peak-throughput number would directly identify that particular barrier as the intervention point.
Three results with different meanings
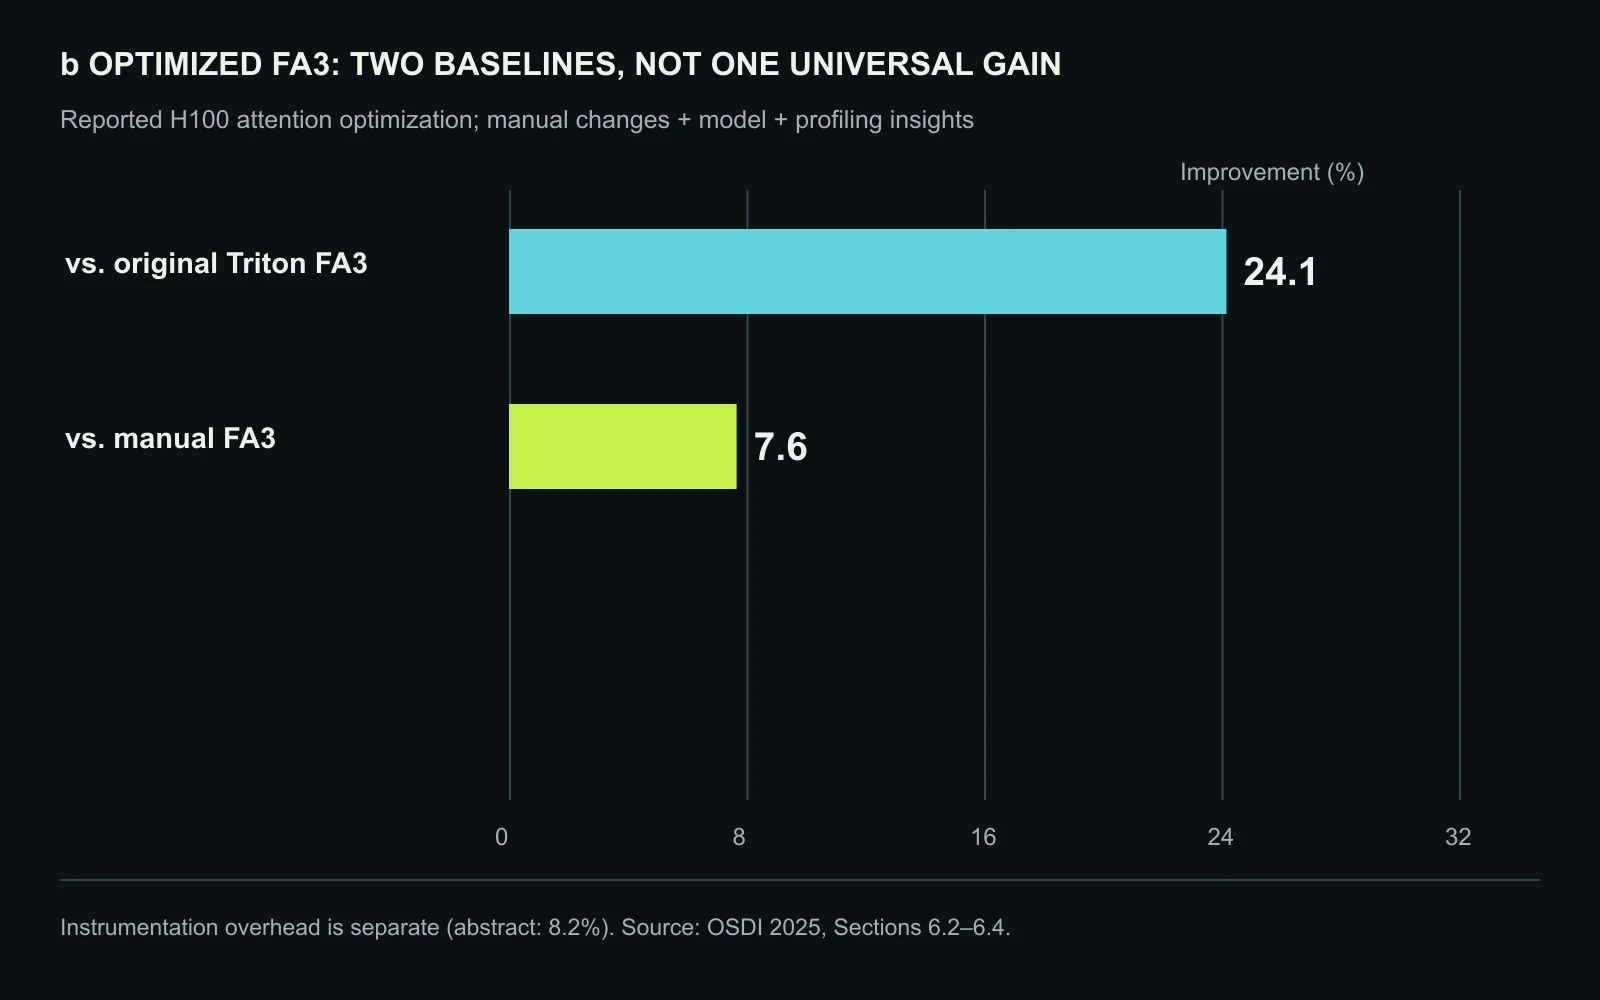
The study reports a 24.1% improvement for its optimized kernel relative to the original experimental Triton FA3 implementation. Against the manual FA3 implementation used in the study, it reports a smaller 7.6% advantage. These comparisons describe the combined optimization workflow, not a generic speedup obtained by attaching KPerfIR to an arbitrary model.
Profiling overhead is a separate result. The abstract reports 8.2%, while the evaluation describes most tested cases below 10% and the more heavily instrumented case within 15%. This is added execution cost while collecting evidence. It should not be subtracted mechanically from the optimized kernel’s improvement, because the final uninstrumented kernel does not need to retain the profiling operations.
The paper also discusses a roughly 2% residual in a low-level GEMM experiment. That comparison is between observed instrumented execution and a model that adds record costs to the original execution. It is not proof that every reconstructed region timestamp is within 2% of a hidden ground truth. Distinguishing this model residual from measurement accuracy prevents an appealing but unsupported guarantee.
Where vendor tools remain necessary
Compiler instrumentation can only read counters exposed through the available instruction interface. Vendor tools can access additional proprietary registers and activity information. KPerfIR therefore complements rather than fully replaces tools such as Nsight Compute or AMD’s profiling stack.
The distinction also applies across system scales. Internal timing can explain why one kernel wastes overlap, but it does not by itself explain a distributed training stall caused by a delayed peer or a serving queue caused by routing. The paper discusses broader and distributed applications, while retaining implementation dependencies for fused communication-computation workloads.
An infrastructure investigation should connect these levels. First establish whether the expensive kernel lies on the workload’s limiting path. Then use internal timing to identify a change. Finally return to the complete workload to determine whether the recovered GPU time changes throughput, latency, or capacity under the actual batch and concurrency distribution.
An optimization workflow that survives a compiler upgrade
A sensible adoption process keeps reproducible source, compiler versions, launch configuration, input shapes, and instrumentation settings alongside each trace. Otherwise a later compiler change can alter both the kernel and the measurement code, leaving no clean explanation for a difference.
Correctness testing must include the transformed dependency structure, not just a favorable performance sample. Attention kernels should be checked across the supported shape and numerical range, including cases where the overlap model predicts less benefit. A faster steady-state loop can still lose on short inputs if additional setup dominates.
After removing instrumentation, repeated benchmarks should test the proposed change against the same original implementation. Application-level tests should then measure representative requests or training steps. A kernel improvement only becomes an infrastructure improvement when the surrounding workload can use the recovered capacity.
We believe KPerfIR’s strongest contribution is making this reasoning more systematic. It gives tool builders a way to connect compiler intent to runtime evidence while exposing the cost of obtaining that evidence. For AI systems, understanding exactly which dependency wastes time is often more useful than collecting another aggregate utilization number.
Sources and rights
This independently written editorial analysis reviews the OSDI 2025 paper and official presentation materials. Reported experimental findings belong to the cited authors; deployment guidance and interpretation are our analysis. Copyright in the original paper remains with its authors, © 2025. Illustrations were created for this article and do not reproduce the paper’s figures.