The common data-center probe has an identity problem. A missing response can mean that the path dropped a packet, but it can also mean that the server process responsible for answering was delayed by CPU load. If the operator runs traceroute afterward, adaptive routing may send that new packet over a different path. The alarm and the diagnosis can therefore describe two different events.
ByteTracker, presented by ByteDance and university collaborators at SIGCOMM 2025, removes both ambiguities[1]. A small set of centralized machines emits controlled probes. The destination operating system answers in the kernel, so no user-space probe agent needs to be installed or kept healthy on every server. Switches mirror the probe and reply packets as they pass, allowing an analyzer to reconstruct the route taken by the original exchange instead of approximating it later.
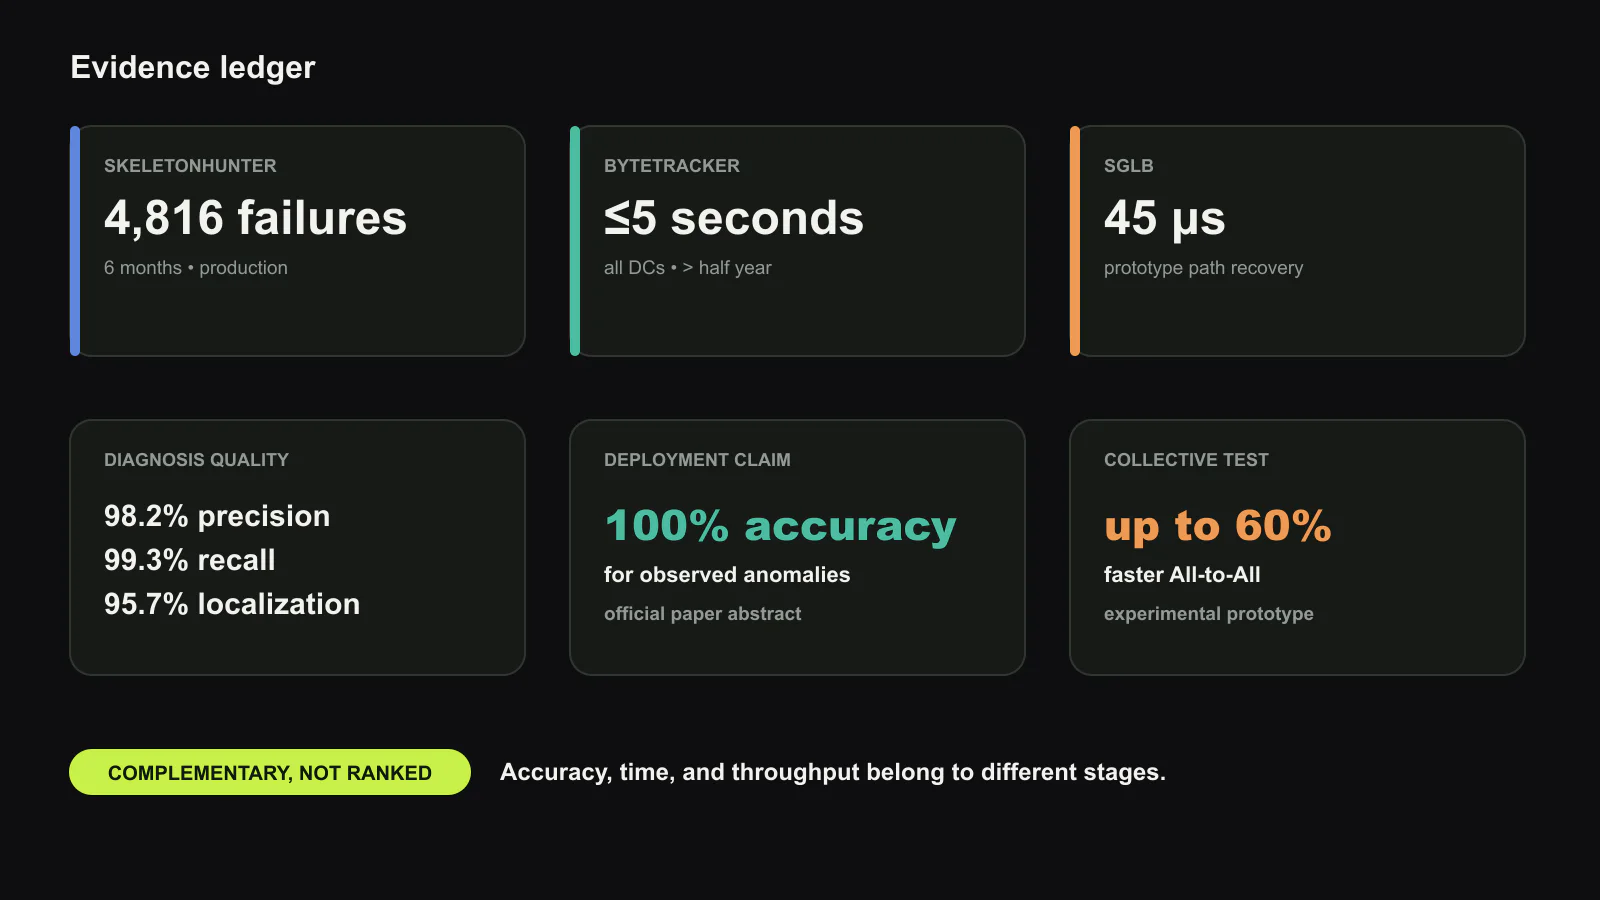
ByteDance deployed the system across all of its data centers for more than six months. The evaluation site described in the paper contains hundreds of thousands of servers. During the reported period, ByteTracker detected 276 network anomalies and localized every observed case correctly within five seconds. The 100% figure belongs to that deployment population. It is not a proof that every possible network or host failure is detectable.
Pingmesh mixes server delay with network loss
Pingmesh-style systems run agents on hosts and continuously measure round-trip time and timeouts[2]. This design has delivered valuable visibility at hyperscale, but the paper identifies four limits that become more expensive as fleets approach millions of servers.
First, user-space responders compete with production processes. A target CPU near saturation may answer late even when the network is healthy. Operators raise an alarm threshold to suppress this noise, which can hide a switch chip dropping fewer than 0.01% of packets. The monitor becomes less sensitive precisely because its endpoint is busy.
Second, location is delayed. A conventional pipeline collects failing five-tuples, then launches traceroute or telemetry queries and votes on common components. This can take minutes. Packet-level and flowlet-level load balancing also mean the diagnostic probe may not follow the path that failed.
Third, an endpoint agent cannot easily distinguish a network timeout from a host timeout. A server reboot, NIC failure, CPU spike, agent crash, and dropped fabric packet all create a missing reply. Pulling every external host event adds overhead and still leaves gaps at millisecond time scales.
Fourth, the probe fleet is software that must be updated and controlled. A faulty release can increase traffic from a vast number of hosts at once. Shutting down a handful of centralized probers is simpler than coordinating emergency action across millions of agents.
ByteTracker does not eliminate endpoint behavior. It chooses a response path with less variable scheduling. A probe targets a reserved invalid TCP port. The operating-system kernel returns a reset packet without a user-space service. Kernel processing has higher priority than a normal agent and remains responsive under the CPU-overload case tested by the authors.
One-shot TCP probes preserve the measurement
The prober constructs a TCP SYN packet through raw sockets and sends it once. This detail prevents automatic retransmission from changing the meaning of the result. A kernel-managed connection may resend a dropped SYN. The later reply then hides the timeout and inflates the measured latency by including the retransmission delay. ByteTracker records the first outcome directly.
The team considered ICMP because the host can answer it cheaply, but chose TCP. A TCP packet exposes a complete five-tuple, so the prober can vary the source port and exercise equal-cost multipath rules. An ICMP echo lacks the port fields needed to cover the same route choices. The invalid destination port is reserved so that no application accepts the request accidentally.
The SYN includes a 512-byte payload. Switches generally divide a large packet into internal cells and reassemble them. Small probes can bypass the logic that fails only during segmentation or reassembly. The chosen size exceeds the cell sizes in the evaluated network and uncovered five large-packet drop incidents that smaller probes would not have exercised.
Replies contain no payload, but both directions matter. The paper’s operating experience found that most drops were one-way. A port’s optical transmitter and receiver can fail independently, and separate fiber cores may carry transmit and receive traffic. A successful outgoing probe therefore does not clear the reverse path.
North-south and east-west patterns cover different switch logic
Low-tier switches often use one switching chip. Covering their links and ports is sufficient to exercise most forwarding paths. High-tier chassis can contain multiple chips connected by an internal fabric. Traffic between two ports on one chip does not test the same hardware as traffic that crosses chips.
ByteTracker uses two probe patterns. A north-south probe travels from a prober near the top of the network to a server and returns. It covers physical links and switch ports along the hierarchy. An east-west probe places a SYN inside IP-in-IP encapsulation and directs the outer packet toward a selected top-of-rack switch. That switch removes the outer header and forwards the inner probe toward the destination, reproducing a server-to-server path through high-tier chassis.
The second pattern is auxiliary but necessary for multi-chip coverage. A chassis can pass all north-south checks while failing only on an internal chip-to-chip route. The paper reports eight silent-drop incidents found through east-west probing. It also concludes that using fewer multi-chip switches reduces both failure exposure and monitoring complexity as single-chip bandwidth improves.
The pattern must still resemble service traffic. The authors found that IP-in-IP probes addressed directly to switch management subnets could miss forwarding defects affecting server prefixes. ByteTracker ultimately targets the server address in the inner packet so that forwarding after decapsulation follows the relevant rule set.
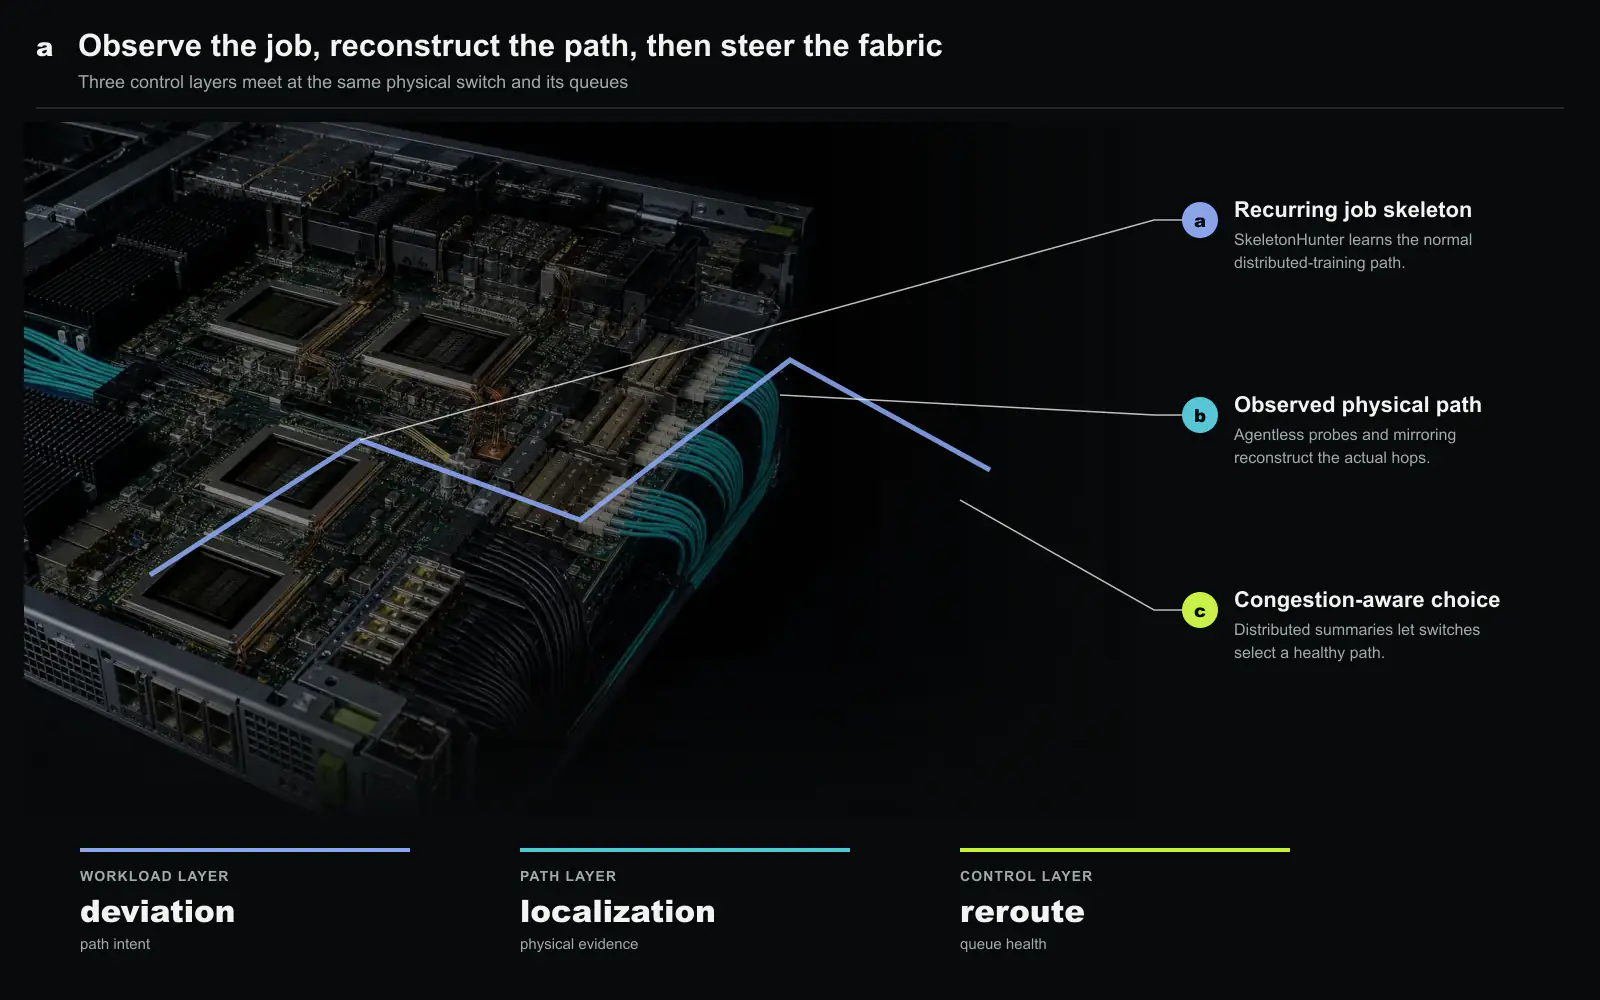
Mirroring turns one probe into a path record
Switches identify probe traffic with a dedicated DSCP value and mirror matching packets using ERSPAN. The copies travel over the management network so they do not consume the service path being tested. An analyzer joins the mirrored SYN and RST packets into a hop sequence, compares packet contents, and classifies the result.
Real-time mirroring removes the time-of-check gap. When a flow is adaptively routed, the path record belongs to the same packet that timed out or changed. Historical five-tuples can also be retained to help when a faulty switch chip drops both the original packet and its mirror. A sudden decline in mirrored copies at the next hop becomes evidence that the preceding device failed.
The analyzer compares payloads hop by hop. This detected two incidents in which bits changed silently yet the packet reached the service path. Tunnel and gateway devices may omit some verification to save processing, allowing corruption that would normally be discarded to continue. A simple timeout monitor cannot detect this case because a response may still arrive.
Timeout classification uses concurrent probes. When a target host is unavailable, several carefully related probes show a shared endpoint pattern. When one network path is faulty, failures align with the mirrored route instead. The design avoids depending on a dense top-of-rack mesh, whose accuracy deteriorates when a rack has few active NICs and whose 100-millisecond interval cannot resolve short host events.
The final locator marks switches traversed by several network-classified timeout probes. It is intentionally conservative about ports: the evaluated ERSPAN version exposes the switch path, not every ingress and egress port identity. Operators still inspect device logs and counters to identify a bad port. Newer mirroring metadata could narrow that boundary.
The deployment result has several denominators
ByteTracker emits roughly three probes per NIC per second. At the central source, the paper reports about 600 Mb/s of probe traffic and 100 Mb/s of replies spread across the entire data-center network. A full probe round completes within approximately three seconds. Mirrored copies use the management fabric. These numbers support low aggregate overhead in the evaluated topology, but another deployment must recalculate them against its number of paths, switch mirror capacity, and management-network headroom.
During six months, ByteTracker reported 276 network anomalies; the incumbent Pingmesh pipeline reported 262. The extra cases were mainly subtle drops previously hidden by endpoint noise. The set also included eight multi-chip silent-drop cases, five large-packet-specific failures, and two bit-flip incidents. These categories overlap the design mechanisms and explain why simple packet-count parity would not be enough.
Localization reached the reported five-second bound after a prober observed network timeouts. All 276 cases in the deployment evaluation were assigned to the correct failed switch. The paper attributes the result to low endpoint noise, explicit host-versus-network classification, same-packet path capture, and requiring multiple observations before marking a device.
Several incident narratives show why the evidence matters. A failed chip can prevent its own mirror copies, apparently marking many downstream switches; the analyzer notices the mirror-count discontinuity. A bad software patch can cause simultaneous drops on several switches; low probe noise lets the system accept that several devices are genuinely faulty instead of dismissing the result as contradictory. A layer-2 loop can be recognized from the repeated mirrored path even though it has no IP time-to-live expiration.
What the probes still cannot see
TCP reachability is not equivalent to RoCE health. ByteTracker can traverse an RDMA network because its NICs also carry TCP, but production fabrics commonly place TCP and RoCE in different queues. Priority flow control deadlock, a bad PFC configuration, or drops isolated to the RoCE class may leave TCP probes healthy. The paper identifies RoCE-queue-specific probes as future work.
Host timeout evidence is also underused. The system distinguishes likely host events so they do not corrupt switch localization, but it does not yet turn those events into a complete server or NIC diagnosis. CPU saturation, a reboot, a flapping NIC, and a route error need additional evidence before the platform can quarantine an endpoint safely.
Mirroring itself is a dependency. Switches must support ERSPAN at the needed rate, the management network must carry copies, and the analyzer must tolerate missing mirror packets. A failure that damages forwarding and mirroring simultaneously requires historical paths and adjacent-device counts. Operators should test this case instead of assuming observability survives every data-plane fault.
Coverage depends on the probe distribution. Three probes per second is an average; rare failures tied to a particular five-tuple, packet size, queue, or chip transition can still escape. A fleet should publish the mapping from failure surface to probe class and identify which surfaces remain untested.
The adoption test is a path-evidence test
The transferable contribution is a stronger evidence contract for active monitoring. Every timeout should retain the probe identity, chosen five-tuple, packet size, direction, send time, kernel reply status, mirrored hop sequence, missing-mirror boundary, and classification confidence. A locator should be able to explain which observations marked the switch.
An operator can validate the contract with injected one-way loss, subtle random loss, large-packet-only loss, internal chassis failure, payload corruption, simultaneous device faults, traffic loops, host CPU overload, agent or prober failure, and a RoCE-only queue defect. The expected outcome is not that one mechanism catches everything. It is that each event enters the correct evidence state and the system states when it lacks coverage.
The service-level metric should connect five seconds to application loss. A distributed-training platform can measure collectives delayed, jobs aborted, and time until the failed component is excluded from new placement. Fast localization only creates value when quarantine, rerouting, or repair consumes the answer.
ByteTracker’s central idea is simple but consequential: do not ask a later packet where an earlier packet went. Record the path of the probe that carried the evidence, and keep the host response outside a user-space agent’s scheduling noise. That shift turns active probing from a statistical hint into a path-aware incident record.
Source and attribution
This article is an editorial summary prepared by Silicon & Systems. It restates the paper’s design, deployment measurements, and limitations in our own words. No source sentences, tables, or publisher figures are reproduced; both figures are Silicon & Systems originals first made for the multi-paper network-operations review. The version of record was published by ACM. Copyright (c) 2025 the authors, with publication rights licensed to ACM. ACM’s eReader provides free access through the DOI page.