An online language model has at least two clocks. Time to first token (TTFT) covers admission, cache lookup and prefill. Time per output token (TPOT) covers a repeated decode path whose latency may drift one step at a time. Modern services add prefix caches, prefill-decode disaggregation, tensor parallelism and expert parallelism[2][3]. A request that misses its SLO can therefore be delayed by scheduling, communication, a slow kernel, an overloaded link, cache behavior or interference in one narrow interval.
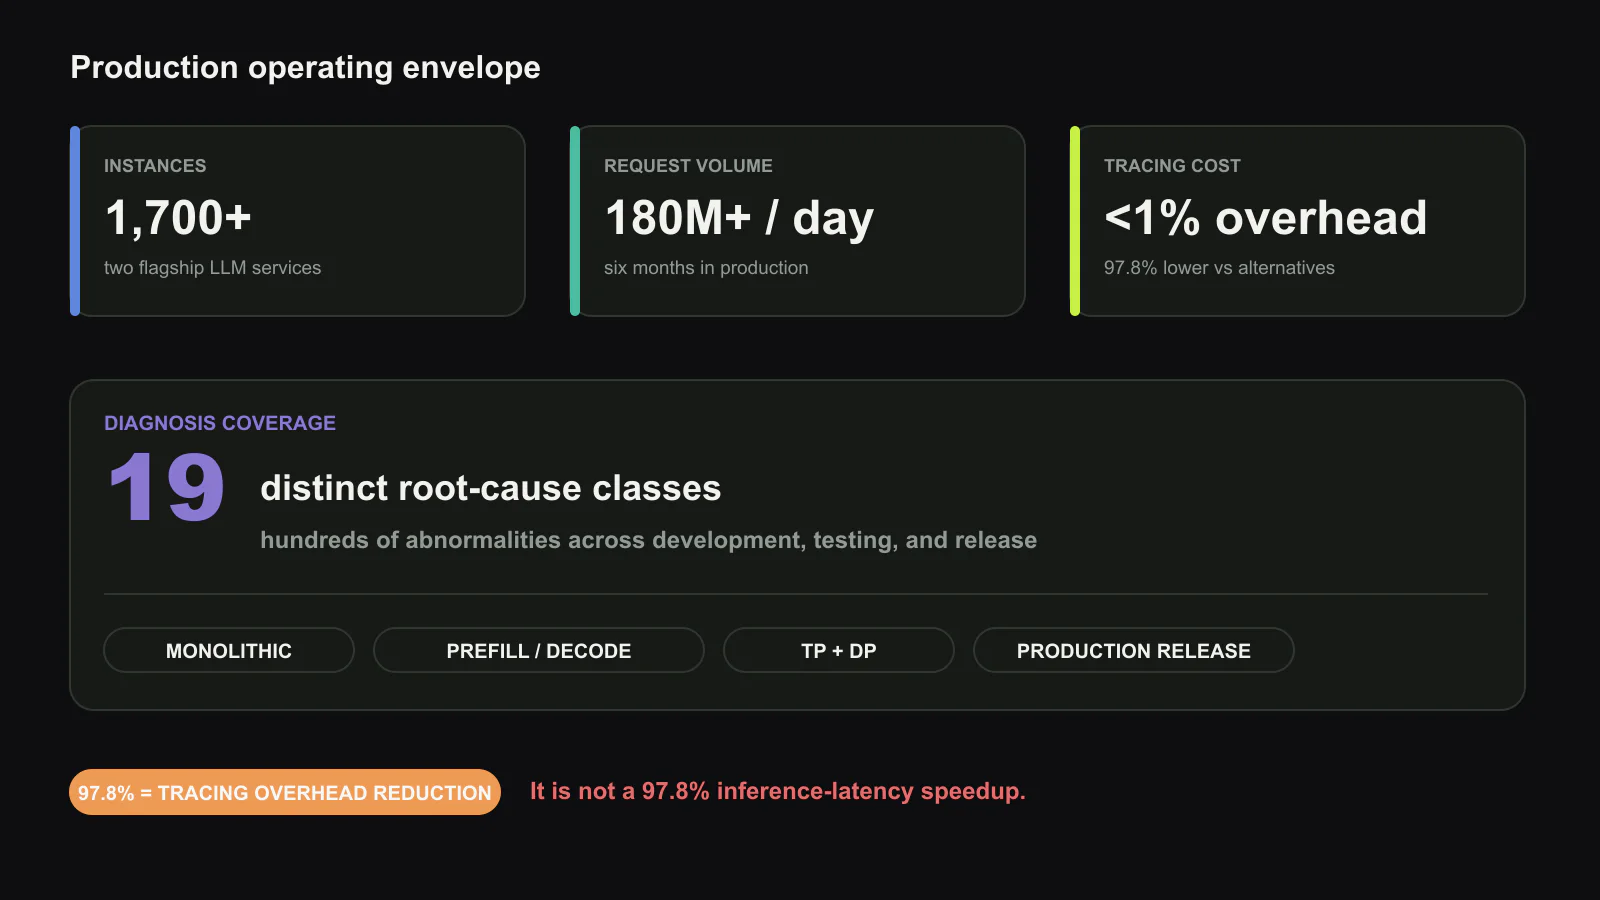
Detailed tracing appears to be the obvious answer, but tracing every kernel and communication event can consume enough CPU, GPU memory and storage to disturb the service. Alibaba’s StriaTrace chooses a selective evidence path[1]. It records low-cost structure continuously and expands detail when an abnormality appears. In production for six months, the system instrumented more than 1,700 instances across two flagship services processing over 180 million requests per day. Reported overhead stays below 1%, 97.8% lower than the evaluated alternatives, and the system identified 19 classes of root cause.
An inference trace needs a different shape
Training observability usually summarizes long iteration steps and recurring collective phases. Online inference mixes requests with different prompt lengths, output lengths, cache states and arrival times. Prefill and decode may run on different machines. A short anomaly can disappear in an iteration average, while a full event stream produces too much data to retain.
StriaTrace starts from three production rules. First, synchronization points expose waiting and therefore preserve causal boundaries. Second, only events on a request’s critical path can extend its latency. Third, fine-grained events are most valuable near an abnormal interval. The always-on layer records enough timing to reconstruct stages and detect that a step moved outside its expected behavior. A triggered layer then captures deeper kernel and communication detail for the suspicious region.
This design is closer to a flight recorder than a continuous video. The sparse record answers when and where the service slowed. The expanded record answers what consumed the interval. Because the trigger is driven by request and step behavior, it can catch intermittent events that disappear before an operator attaches a general-purpose profiler.
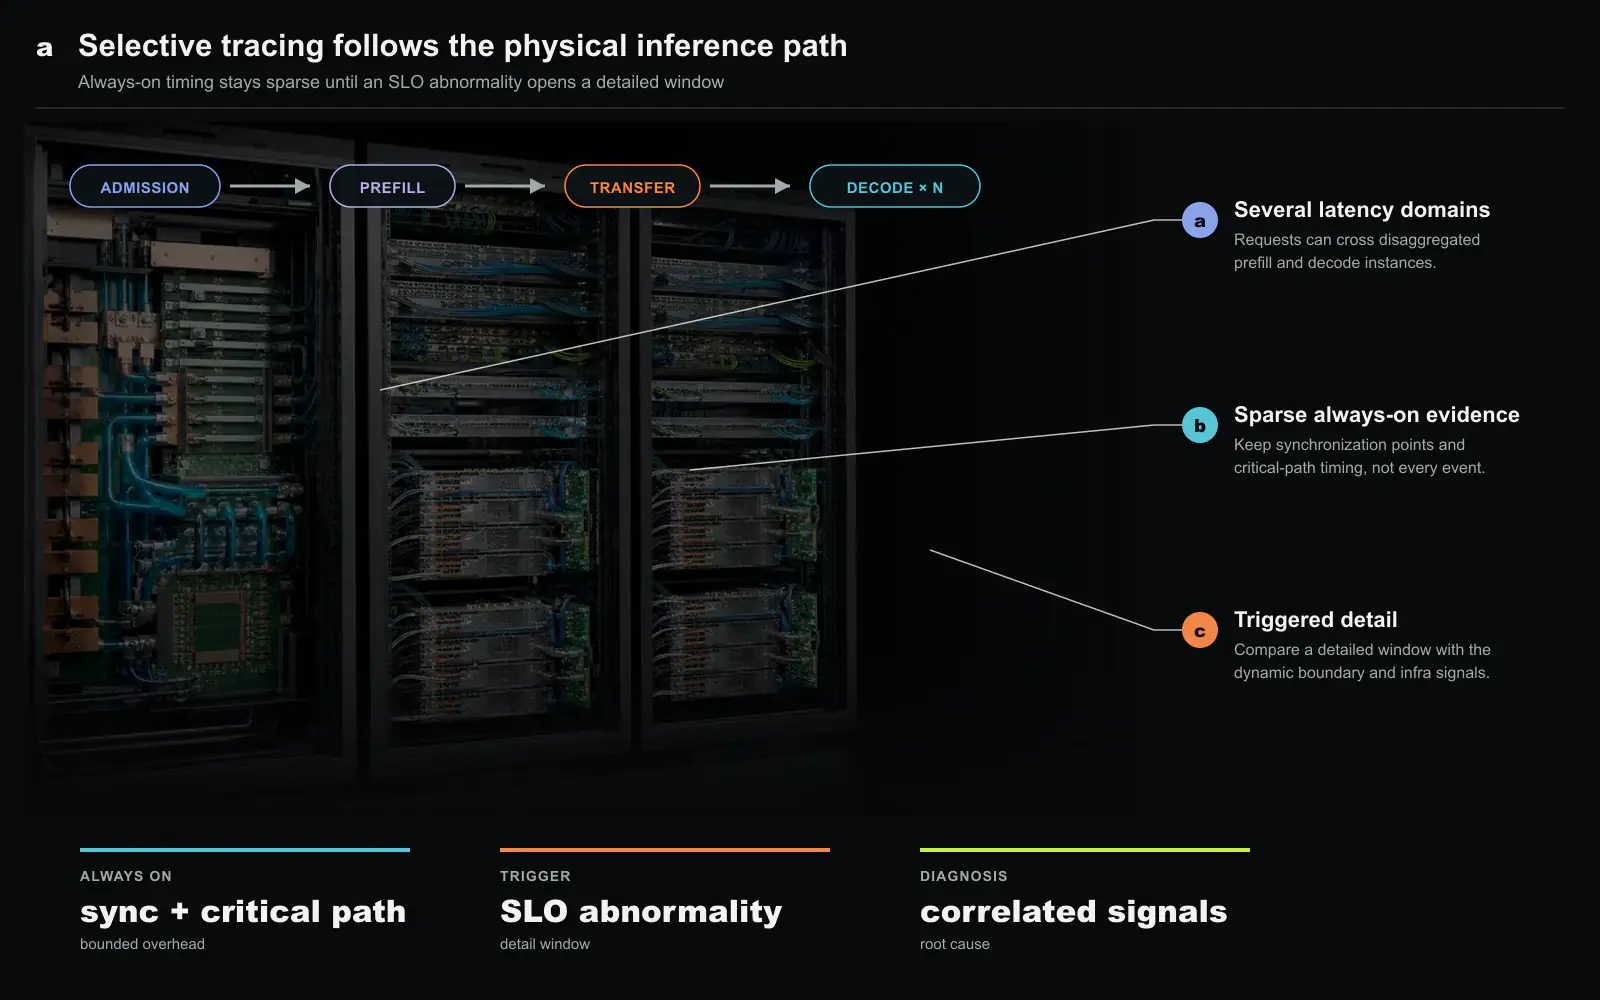
From a slow step to a cause
Collection alone does not explain a miss. StriaTrace builds a regression-based dynamic roofline for inference steps. A conventional roofline relates arithmetic work, data movement and hardware limits. Here the expected boundary must also change with request state, batch composition and model phase. The model distinguishes a step that is slow because it contains more legitimate work from one that underperforms for its conditions.
The diagnosis stage correlates the abnormal step with events and metrics across the serving stack. A compute-bound departure may point to kernel execution or contention. A communication-shaped departure can be tested against collective and network signals. Waiting at a synchronization boundary identifies the component that arrived late rather than the ranks that merely waited for it. The output is not a universal proof of causality, but a narrowed, ranked explanation with the trace context an engineer needs.
This matters in a distributed inference service because a symptom is replicated. If one expert-parallel rank slows, every peer can show a longer collective. Looking at utilization alone produces many identical victims. Critical-path and synchronization evidence separates the late producer from the waiters.
What the production numbers establish
The deployment scale is unusually specific: over 1,700 instances, two large services, more than 180 million requests each day, and six months of production operation. It includes both monolithic and prefill-decode-disaggregated deployments, as well as tensor- and data-parallel configurations. Across development, testing and release cycles, StriaTrace diagnosed hundreds of abnormalities belonging to 19 distinct root causes.
The overhead result also needs its denominator. The paper reports less than 1% tracing overhead and a 97.8% reduction relative to alternative tracing approaches. The second number is not a 97.8% latency improvement for inference. It describes the reduction in observability overhead. Its value is operational: tracing can remain enabled rather than being attached after the anomaly has passed.
The blind spots remain important
Selective tracing depends on the trigger. If a quality regression changes generated content without creating a timing abnormality, StriaTrace is not the detector. A fault that changes every request slowly may also become part of the learned normal boundary unless release comparison or an external SLO catches it. Correlation narrows a diagnosis, but correlated telemetry can still share a downstream cause.
There is another practical limit. The paper reports root-cause classes and production cases, not a public labeled corpus from which an independent reader can calculate diagnosis precision and recall. The deployment evidence is strong for usefulness and coverage, while the exact false-diagnosis rate is not summarized as one comparable metric. Operators evaluating a similar design should ask how triggers are calibrated, how long detailed windows are retained, and how often the ranked cause led to the final fix.
StriaTrace’s transferable idea is an observability budget. At inference scale, recording everything is not neutral and recording only aggregate counters is not explanatory. The useful middle ground preserves causal structure continuously and purchases detail only when the request gives a reason. That makes diagnosis a designed part of the serving path rather than an emergency profiler session.
A trace budget should follow causality, not traffic volume
The production result supports a more general observability rule. The value of an event is not proportional to how often it occurs. Synchronization points are sparse but tell the system which component could have delayed the critical path. A detailed kernel event is plentiful but often irrelevant until an SLO miss has narrowed the time and request. StriaTrace spends its always-on budget on causal structure, then spends detail only after the posterior probability of usefulness rises. That is why the design can lower tracing cost without merely sampling fewer requests.
This approach also introduces a new failure mode: the trigger can be wrong. If the sparse layer fails to retain the synchronization edge that explains an anomaly, no amount of detailed tracing after the trigger will reconstruct it. The production evidence should therefore be read with two coverage numbers, not one overhead number. Operators need the fraction of true incidents that generated a usable trigger and the fraction of triggered windows that produced a correct diagnosis. The published 19 root-cause classes demonstrate breadth, while an adopter still has to validate coverage for its own kernels, parallelism schemes, and request-routing path.
For capacity planning, the relevant output is not a prettier trace. It is the reduction in time spent below an SLO and the engineering hours required to restore it. A mature deployment should link each diagnosis to mitigation, recurrence, and customer impact, then retain exemplars as regression tests. This turns tracing from a postmortem tool into a feedback system for releases. StriaTrace’s insight is that observability at inference scale is a staged decision process: preserve just enough structure to know where to look, open the expensive window only when evidence warrants it, and close the loop by proving that the same cause no longer reaches production.
Tail latency also needs a causal denominator. A p99 value mixes queueing, prefill, token-by-token decode, cross-instance transfer, kernel execution, and network delay. Optimizing the largest average component can leave the rare critical path unchanged. StriaTrace’s dynamic boundary is useful because it asks whether a component was slow relative to the request’s own operating condition, not whether it exceeded one fleet-wide constant. Adopters should verify that the model remains calibrated across model versions, sequence lengths, batching policies, and hardware generations. A boundary trained on yesterday’s traffic can convert normal workload drift into an incident flood.
Selective detail creates a data-governance advantage and obligation. Capturing fewer events reduces storage and the surface on which prompts, identifiers, or model behavior may leak, but the triggered windows are precisely the abnormal requests operators are most likely to retain and inspect. A production design should specify redaction, access, and retention at the same granularity as the trace stages. The analytical point is that observability cost is not only runtime overhead. It includes storage growth, privacy exposure, and the human attention consumed by false triggers, all of which must be counted when comparing an always-on tracer with a selective one.
Capture recall is the first reliability metric
Selective tracing saves overhead by deciding when detail is worth collecting. That decision creates a detector in front of the diagnostic system, and the detector can miss the only request that explains an incident. The first operational metric should therefore be capture recall: among incidents later confirmed by an independent signal, how many retained a usable critical path and opened a sufficiently detailed window?
Recall must be measured by incident class. Queueing anomalies, slow collectives, kernel stalls, routing mistakes, and gradual regressions produce different signals. A trigger tuned for a sudden latency spike can miss a release that shifts every request by a smaller amount. A fixed fleet-wide threshold can also misclassify a legitimate change in model, sequence length, or batch policy. StriaTrace’s dynamic model helps establish a local expectation, but the model itself requires drift monitoring.
Teams can build the measurement from release canaries and controlled fault injection. Deliberately delay one synchronization point, restrict one link, perturb a batch queue, or introduce a known kernel slowdown in a test environment. Then verify that the sparse trace preserves the causal skeleton, the detailed mode opens at the right interval, and the diagnosis ranks the injected cause near the top. This converts observability from a passive tool into a regression-tested part of the serving system.
Diagnosis needs a closed operational loop
A ranked cause is not the end product. Each diagnosis should be linked to the mitigation that was attempted, the change in SLO violations, and whether the same signature returned. This record separates a plausible correlation from a useful explanation. It also supplies labeled examples for recalibrating the dynamic boundary and correlation rules without treating every historical alert as truth.
The loop should distinguish immediate containment from permanent correction. Routing around a slow instance may restore service, while the underlying cause remains a thermal limit, firmware defect, network path, or workload-specific kernel. If the incident record ends when latency recovers, the system will learn that rerouting is the cause rather than the mitigation. StriaTrace provides the request-level evidence needed to keep those roles separate.
Human attention belongs in the cost model. A tracer with negligible runtime overhead can still be expensive if it produces broad, unstable candidate lists that engineers must inspect. Useful reporting includes time from first SLO violation to actionable hypothesis, time to mitigation, and engineer-hours per confirmed cause. Those outcomes reveal whether selective detail actually reduces operational work.
The trace is also sensitive data
Inference traces can carry request identifiers, prompt-derived sizes, model routing decisions, tenant information, and timing patterns. Selective collection reduces total volume but concentrates attention on unusual requests, which may be precisely the records an operator retains longest. Data minimization must therefore follow the same staged design as performance collection.
The always-on layer should keep only the identifiers and synchronization timing required to reconstruct causality. Detailed payload fields should be removed, hashed, or replaced with bounded metadata unless a separate authorization permits access. Retention can be shorter for raw detailed events and longer for derived incident summaries. Access logs should record who opened a trace and which incident justified it.
Cross-tenant diagnosis needs additional care. A shared GPU or network path may create correlated latency without allowing one tenant’s trace to reveal another tenant’s workload. The system can aggregate resource pressure and topology at the shared layer while keeping request content and model identity within the tenant boundary. This is an architectural requirement, not a documentation detail, because the useful causal edge often crosses the same boundary that policy must protect.
Observability capacity should follow the critical path
The paper’s 97.8% reduction in tracing overhead shows that continuous operation becomes feasible under its evaluated conditions. The next procurement question is how many synchronization edges, detailed windows, and retained incidents the platform can support before storage, analysis, or people become the bottleneck. Traffic growth alone should not determine that budget. A new serving architecture with more cross-node dependencies may need more causal coverage even at the same request rate.
We read StriaTrace as an argument for preserving structure continuously and buying detail only when evidence warrants it. The design is strongest when the sparse layer has high capture recall, the dynamic model follows workload drift, and every diagnosis closes with a verified operational outcome. Under those conditions, tracing is not a tax added after deployment. It becomes part of the release gate that prevents a known failure path from returning to production.
Source and attribution
This article is an editorial summary prepared for Silicon & Systems. It restates the cited paper in our own words. No text, tables or figures from the paper are reproduced; both figures were created for this article. USENIX provides the paper through its open presentation page. Copyright (c) 2026 the authors.