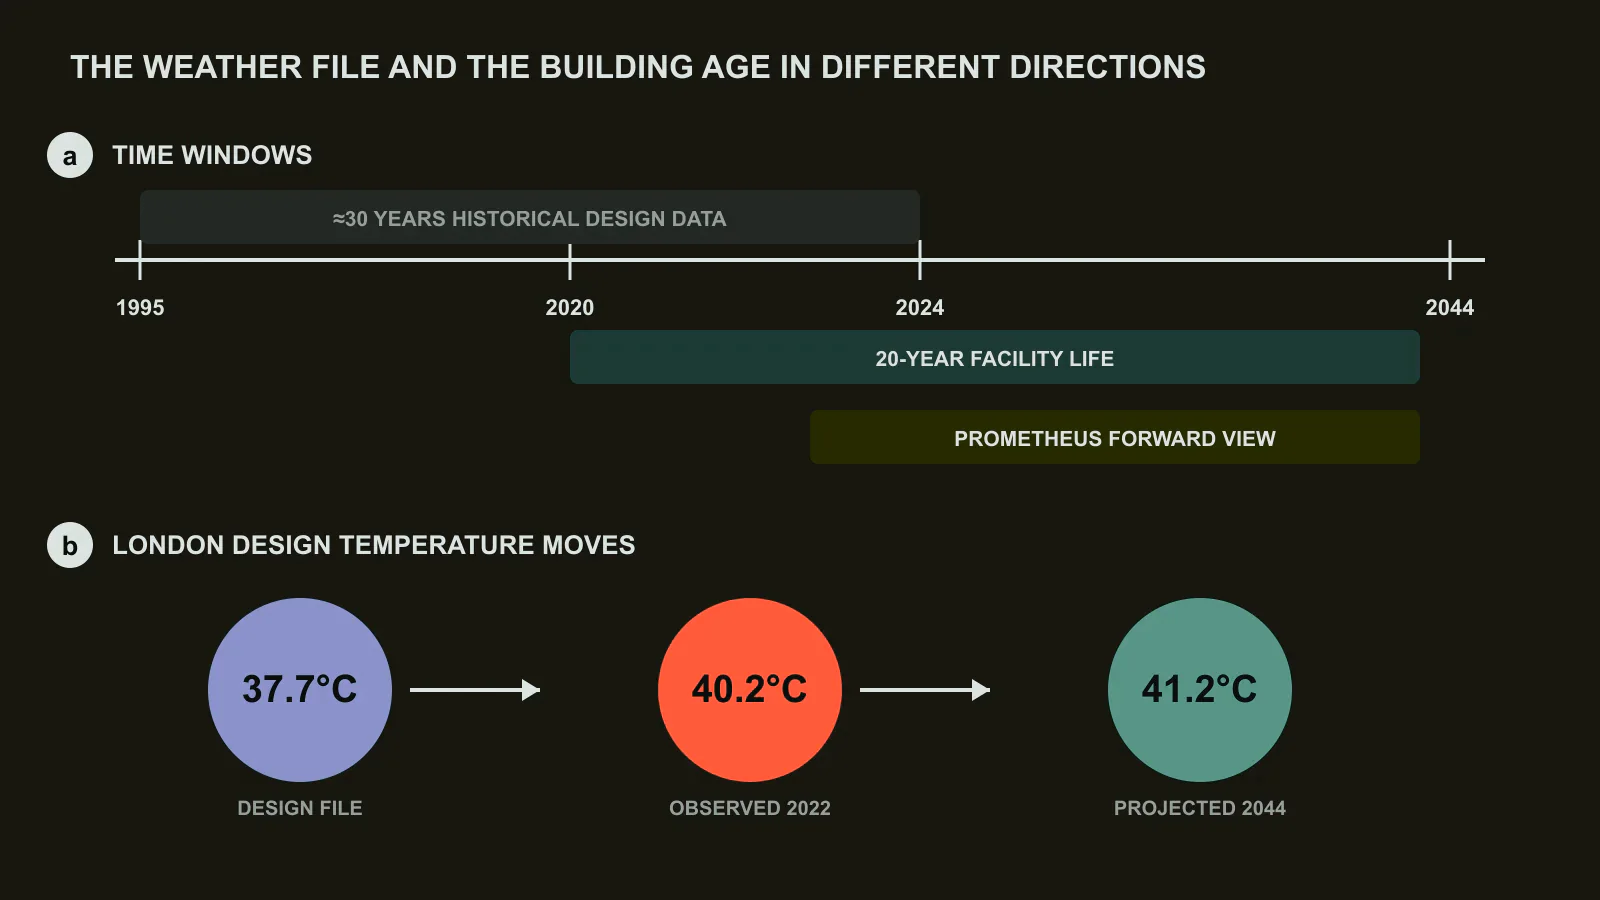
A datacenter may operate for 20 years, yet its cooling plant is commonly sized from the previous 30 years of weather. The two intervals no longer describe the same climate. During the United Kingdom’s 2022 heatwave, temperatures reached 40°C and Google observed elevated server errors and degraded operation for 35 hours[1]. The standard design point of 37.7°C had historically represented an event expected about once in 200 years. Forward projections make it closer to once in 50.
Prometheus, presented by Google and the University of Pennsylvania at ISCA 2026, treats that mismatch as a computer-systems problem rather than a footnote in facility design[1]. It combines 25 years of observations with 20 years of climate projections, estimates how each site will cross its dry-bulb or wet-bulb limit, then attaches an action to three horizons: infrastructure planning over 20 years, upgrades over two years and workload response over two weeks. Across 30 production datacenters, the method calls for 11% more cooling capacity on average. The largest site-level requirement reaches 48%.
A design temperature is a probability statement
Cooling capacity depends on two different descriptions of heat. Dry-bulb temperature is the familiar ambient reading and matters for systems that reject sensible heat to outside air. Wet-bulb temperature also includes humidity and bounds what evaporative cooling can achieve. A site can therefore be limited by a hot dry afternoon or by a cooler but humid day. Prometheus models both instead of applying one global margin.
Its forecasting pipeline uses support-vector machines and random forests as base models, with a neural network combining their outputs. The training data joins site observations to CMIP6 climate projections[3]. Against analytic baselines, the learned model reduces wet-bulb error by 40% to 60%. One representative root-mean-square error falls from 1.7°C to 0.7°C, while error at the 99.5th percentile declines by more than 60%. Accuracy at the tail matters because the cooling plant is sized for the few hours the average conceals.
The change is not uniform. Compared with ASHRAE weather files[2], Prometheus finds an average 4.4°C difference in dry-bulb design conditions and 1.4°C in wet-bulb conditions. For 2044, the SSP5-8.5 high-emissions case produces dry-bulb increases whose smallest and largest values are 2.0°C and 10.7°C. Its wet-bulb counterpart rises between 2.7°C and 6.8°C. London illustrates the sequence: the design file says 37.7°C, the 2022 observation reached 40.2°C, and the 2044 projection reaches 41.2°C. The old margin did not merely become smaller. It was spent before the building reached the middle of its life.
Thirty sites do not need the same margin
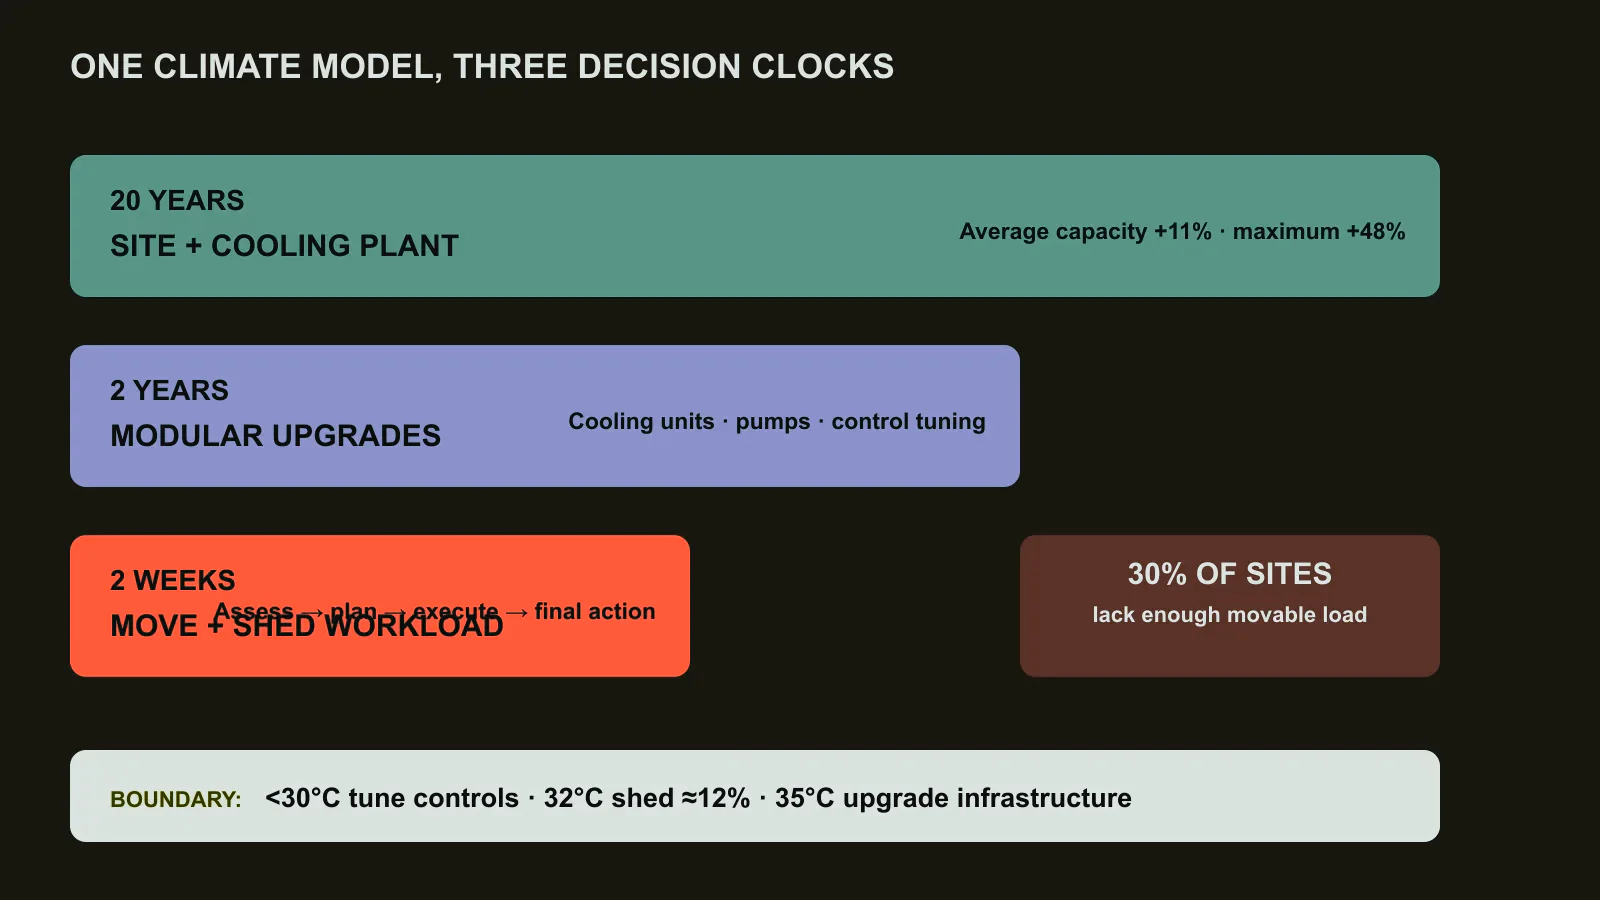
Applying the model to Google’s fleet produces a distribution rather than a corporate rule. The average site needs an 11% increase in cooling capacity. The most exposed dry-bulb location needs 39%, and the most exposed wet-bulb location needs 48%. Meanwhile, 12% of sites already face an annual probability above 2% of exceeding their design condition. An event described as exceptional in a building standard has become an operational scenario.
Workload flexibility does not remove the infrastructure gap. In the production sample, 30% of datacenters lack enough load that can be shed or migrated during extreme heat. Most sites can move less than 20%, and each 10% reduction in compute lowers the cold-aisle requirement by about 1°C. The resulting 1°C to 2°C benefit is useful around the edge of the operating range, but cannot cover a projection that moved by 6°C or 10°C.
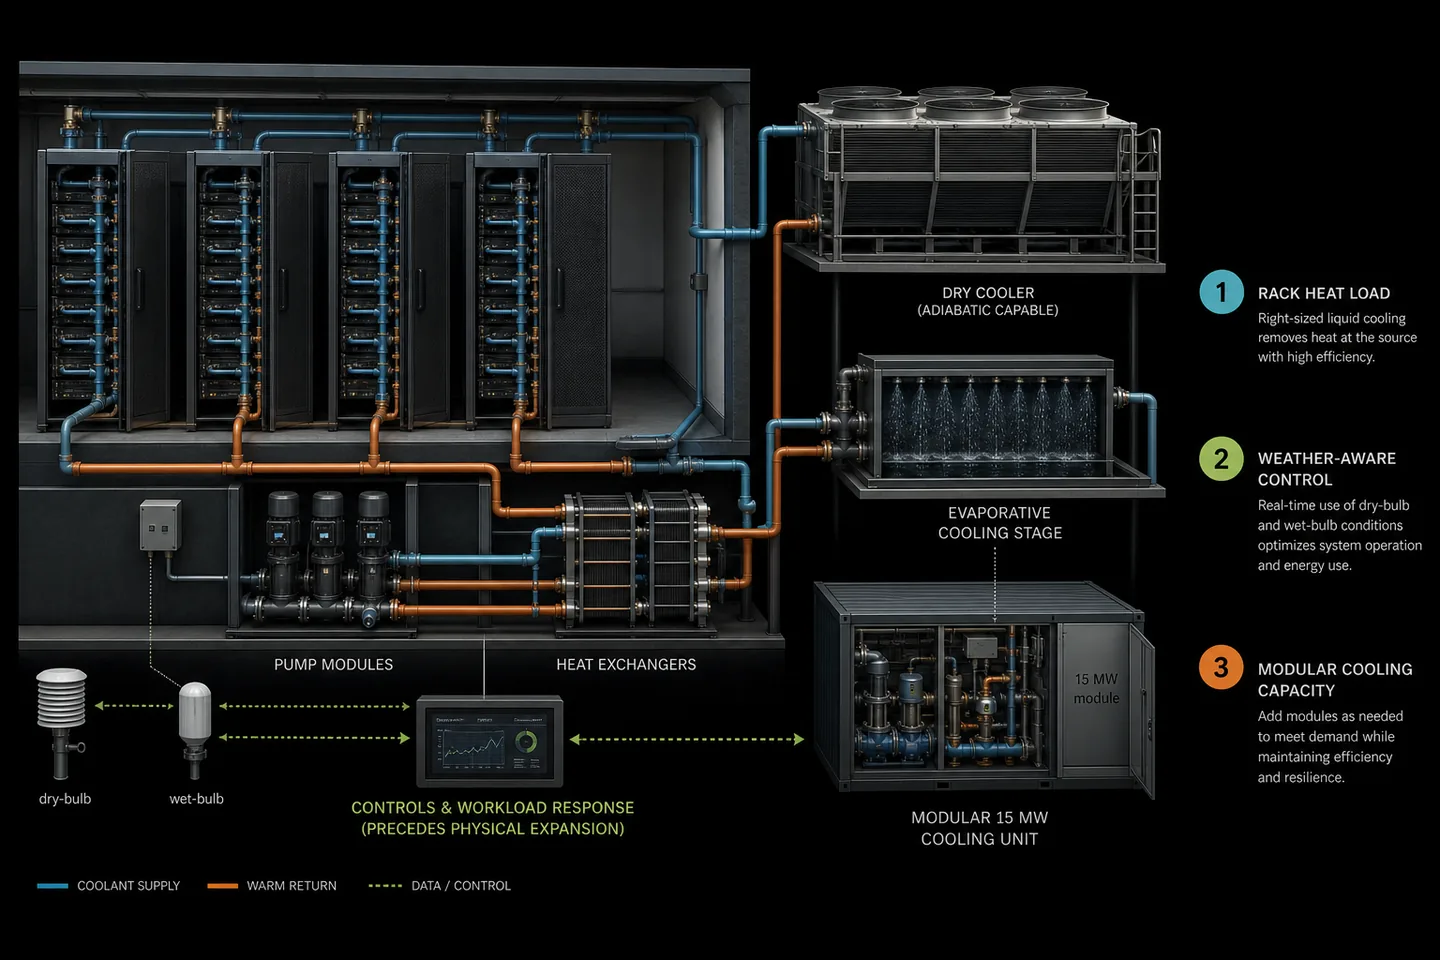
The paper translates this boundary into a concrete wet-bulb example. Below 30°C, control tuning may maintain service with less than 3% load shedding. At 32°C, the requirement rises to about 12%. At 35°C, it reaches 30%, which the authors treat as operationally infeasible and therefore an infrastructure-upgrade case. Cooling equipment also comes in discrete increments, commonly around 15 MW, so the final decision is not a smooth percentage slider.
One forecast, three clocks
Prometheus is most interesting where it connects facility and software time scales. The 20-year forecast informs site selection and the installed cooling plant. A rolling two-year view decides where modular units, pumps or controls should be upgraded. A two-week forecast initiates the operating runbook before the temperature arrives.
That runbook begins about 14 days ahead with a risk assessment. Eight to ten days out, operators select migrations and shedding plans. Four to seven days out, they execute data movement and service changes, leaving the final day for last adjustments. The lead time is not generous at hyperscale. Moving 10 MW of compute can mean roughly 200,000 virtual machines and 3.2 PB of memory. Even a continuous 50 Gb/s transfer takes about a week to move that memory volume, before application dependencies are counted.
The economics support selective upgrades instead of a universal overbuild. A hyperscale facility costs roughly $7 to $12 per watt, of which cooling represents 15% to 25%. Adding 20% to cooling capacity therefore costs an estimated $0.20 to $0.60 per watt. The paper’s lower-bound estimate for the 35-hour London event is $0.44 per watt in service impact. With a typical 10% capacity addition and the software value protected by availability targets, the authors estimate that an upgrade can be about four times more favorable than absorbing the disruption. This is a planning comparison, not a universal tariff, but it places climate risk in the same units as datacenter capital.
The missing input to AI capacity planning
AI infrastructure discussions often count megawatts as if the value were available in every hour of the facility’s life. Prometheus shows that cooling can make electrical capacity conditional on local weather, humidity and movable workload. A 100 MW campus with insufficient heat rejection does not own 100 MW during the event that defined its design.
The practical lesson is to preserve the distribution. Fleet averages cannot size individual sites, and a dry-bulb margin cannot stand in for wet-bulb exposure. Operators need site-specific projections, calibrated tail error and an explicit boundary between control tuning, workload response and physical expansion. The same forecast should reach the facilities team early enough to buy equipment and the scheduler early enough to move state.
The paper also has limits. Climate projections depend on emissions scenarios, and the study reports an anonymized production fleet rather than full site-by-site designs. Its cost model uses lower-bound interruption estimates and cannot capture every service contract. Nevertheless, the systems contribution is clear. Weather data has a version, and a datacenter whose design input is never updated is running critical infrastructure on an expired dependency.
Turn the forecast into an admission-control input
A climate projection becomes operational only after it changes an admission decision. The facility team can express each site’s safe IT load as a table indexed by dry-bulb temperature, wet-bulb temperature and equipment availability. The scheduler then evaluates a reservation against the lowest capacity expected during its execution window, rather than against the annual nameplate. This makes weather risk visible before a long training run starts.
The table needs confidence bands. A forecast of 32°C with a two-degree error cannot be treated as a deterministic 32°C event when the operating curve steepens near that point. Operators can propagate the calibrated tail error into a conservative capacity interval and reserve only the lower bound for inflexible work. The difference between the lower and central estimates can remain available to interruptible jobs. Forecast uncertainty thereby becomes a scheduling class instead of an unpriced facility margin.
State movement must be budgeted explicitly. The paper’s 3.2 PB example shows that “migratable” is not a binary workload property. A service may support restart at another site but still require too much memory, checkpoint data or cache state to move after a warning arrives. For every workload class, the operator needs a transfer volume, minimum useful bandwidth, restart time, data-residency constraint and latest safe trigger. A two-week forecast creates value only when this dependency graph has been prepared in advance.
Migration can also move the problem. Two sites may share the same weather system, or the receiving site may have spare electrical capacity but insufficient cooling margin. Network transfers add power at both endpoints and can compete with production traffic. A fleet-level controller should therefore evaluate correlated weather, receiving-site derating and transfer cost together. Geographic diversity is useful when it produces independent thermal risk, not merely when two datacenters have different addresses.
The upgrade decision should use avoided curtailed compute-hours. A 15 MW cooling module does not create 15 MW of IT capacity in every hour; it raises capacity only where the previous derating curve was binding. Its value is the integral between the old and new curves over the expected weather distribution, multiplied by the value of the protected workloads. This calculation prevents a rare maximum temperature from justifying an oversized plant without considering frequency, while still giving tail events the economic weight of the services they threaten.
Water and energy constraints can change the preferred response. Evaporative cooling may preserve IT power during dry heat but increase water use. Mechanical cooling may handle humidity while raising electrical demand precisely when the grid is stressed. Workload shedding consumes neither new cooling equipment nor water, but sacrifices compute and may violate service commitments. Prometheus supplies the temperature probability; the operator must attach local resource prices and policy limits before selecting the mechanism.
A practical validation exercise should replay historical extremes and synthetic future conditions through the entire chain. The test begins with the forecast, produces a site capacity curve, triggers migrations or shedding, and checks whether the cooling plant and service objectives remain inside their limits. Component tests alone are insufficient. A forecast can be accurate while the migration finishes too late, and a cooling module can meet its rating while a control sequence prevents the system from reaching it.
Finally, ownership must follow the three clocks. Facilities planners own the 20-year physical envelope, capacity engineering owns the rolling upgrade plan, and service operators own the short-term response. One shared risk record should connect them: the climate scenario, forecast version, equipment state, movable load and residual exposure. Without that record, each team can satisfy its local target while the site remains underprotected. Prometheus is therefore as much an interface proposal as a forecasting method. It defines the information that must cross from climate science into facilities and then into the cluster scheduler.
Cooling turns electrical capacity into a derating curve
The usual campus specification states one IT megawatt number. Prometheus implies a more honest representation: available IT power as a function of outdoor dry-bulb temperature, wet-bulb temperature, equipment state, and movable workload. The curve stays flat while cooling has margin, then bends as controls, migration, and shedding are consumed. Beyond a site-specific point, another electrical megawatt cannot become compute because the facility cannot reject its heat.
This curve should enter both capacity sales and scheduler policy. A neocloud that sells annual GPU availability against nameplate power can overcommit the few hours that dominate climate risk. Reservations should identify which workload can migrate, how much state must move, and how early the forecast must trigger. The two-week horizon in the paper is therefore part of capacity, not only a weather alert. Without enough lead time, technically movable compute is operationally fixed.
The investment decision also becomes clearer. Physical cooling expansion purchases a higher and flatter derating curve for decades. Software response purchases flexibility near the edge but loses accelerator time and may move customer data. Site diversity purchases a second weather distribution, provided network and data constraints permit relocation. These options should be compared by protected useful compute-hours, not by cooling watts alone. Prometheus’s larger systems insight is that climate resilience is a joint contract among facility design, forecasting error, data movement, and workload SLOs. Leaving any one outside the model makes the reported megawatts less real exactly when the site is under the most stress.
Climate uncertainty should become an operating envelope
A future-weather model does not produce one correct design temperature. It produces a distribution whose uncertainty comes from emissions pathways, regional climate models, local observations, downscaling, and the relationship between outdoor conditions and site equipment. The engineering task is to choose an acceptable service and equipment risk within that distribution.
The envelope should include dry-bulb and wet-bulb temperature, humidity, duration of extreme events, nighttime recovery, smoke or dust where relevant, and concurrent grid conditions. Cooling systems respond differently to a short peak and a multi-day event. A design that survives one hot hour may accumulate temperature when nights no longer cool enough to reset the site.
Operators should preserve the assumptions used at each design stage. If new observations or climate projections move the distribution, the site can compare the new risk with the remaining margin. This is more actionable than declaring the original weather file obsolete because it shows which equipment, control setting, or expansion phase needs revision.
Cooling capacity needs the same hierarchy as power control
Thermal response spans several clocks. Device and rack controls react quickly to local temperature. Pumps, fans, and cooling towers adjust over seconds and minutes. Chiller staging, workload movement, and capacity planning operate more slowly. One controller cannot optimize all horizons without either overreacting to noise or responding too late.
The hierarchy should expose available thermal headroom to the scheduler. A rack approaching a coolant or air limit may accept a memory-bound job but not another dense training job. A site facing a forecast heat event can defer flexible work, reduce device power, or move new admissions before temperatures reach an emergency threshold. These actions are useful only if performance and completion deadlines remain part of the decision.
Control interactions require testing. Raising coolant temperature can improve economizer hours but reduce component margin. Increasing fan speed consumes electrical capacity that might otherwise feed compute. Power derating lowers heat but can lengthen a job into the hottest part of the day. The site model should calculate these exchanges rather than optimize cooling energy in isolation.
Resilience is more than installed redundancy
N+1 equipment counts do not guarantee N+1 capacity during the future design event. A redundant cooling unit can deliver less output at higher ambient or wet-bulb temperature, and maintenance can remove a different component at the same time. The facility should calculate deliverable cooling under credible combinations of weather, equipment outage, fouling, and utility constraint.
Commissioning should reproduce the control sequence as well as the load. Operators can stage rack heaters or controlled compute workloads, disable equipment, vary setpoints, and confirm that sensors, valves, pumps, and software agree. The test should track rack inlet or coolant temperature, component throttling, recovery time, and power consumed by cooling. A pass means the workload remains within its declared envelope, not merely that the plant stays on.
Water availability can be another failure condition. Evaporative systems may perform well in heat but face seasonal or emergency restrictions. Reporting water-use effectiveness as an annual average misses coincidence between maximum demand and local scarcity. Site planning should include the operating mode and compute derating available when water use must fall.
Expansion plans should carry a cooling option value
A data center often adds IT capacity in phases while cooling equipment and distribution are committed earlier. Designing every phase for the highest projected extreme can strand capital, while designing only for historical weather can block later racks. The plan can preserve option value through modular equipment, space and connection points, higher-temperature-capable distribution, and controls that support temporary derating.
The economic comparison should combine capital, cooling energy, water, lost compute during constraints, and the probability of retrofit. A cheaper initial plant can be more expensive if future heat forces emergency chillers or permanent workload limits. Conversely, flexible compute may justify a smaller plant when the operator can prove that deferral and derating meet customer contracts.
We read Prometheus as a method for attaching the datacenter’s operating life to its weather evidence. The important output is not a more alarming temperature. It is a site-specific curve that tells the scheduler and expansion plan how much compute remains deliverable under future conditions, equipment loss, and resource constraints. Cooling then becomes part of the capacity promise rather than a static mechanical margin.
Source and attribution
This article is an editorial summary prepared for Silicon & Systems. It restates the cited paper in our own words. No text, tables or figures from the paper are reproduced; the figures were created for this article from reported results and architecture. The version of record was published by IEEE in the proceedings of ISCA 2026. Copyright (c) 2026 IEEE. The paper is available through its DOI record.