Neoclouds sell a result, not merely a GPU: a distributed job should start, feed data, communicate, survive faults and finish within a predictable budget. Public evidence rarely measures that whole path. One provider reports the share of healthy network links, another publishes storage throughput from fio, another gives mean time between infrastructure failures for a customer cluster, and a fourth document may describe orchestration features without a comparable workload result. Placing those values in one ranking creates precision without comparability.
The 2025 disclosures from CoreWeave, Nebius and Lambda illustrate three useful evidence styles. CoreWeave provides detailed network and storage engineering claims, including a reproducible benchmark configuration[1][2]. Nebius exposes customer-cluster reliability and recovery metrics with explicit caveats[3]. Lambda describes the architecture and operating interfaces for dedicated, multi-cloud GPU clusters but offers fewer directly comparable performance or reliability measurements in that document[4]. This article asks what each disclosure establishes and what a buyer must still verify.
CoreWeave: component telemetry and a disclosed storage test
CoreWeave states that it operates millions of InfiniBand links and gives “99.9975” as the share that, at a given point, can deliver at least 95% goodput[1]. The sentence implies a percentage, but the public page does not print a percent sign or another unit beside 99.9975. The network stack uses NVIDIA Quantum-2 InfiniBand with SHARP and SHIELD, and an eight-NDR node exposes 3.2 Tb/s of accelerator-facing bandwidth. This is fleet telemetry reported by the company. The post also does not define the observation interval, sample distribution, failed-link treatment or whether application collectives achieve the same goodput. It is useful evidence of an operating metric, not an independent end-to-end benchmark.
The storage post gives more method. CoreWeave ran fio with CPU-driven I/O on H200 nodes, separating storage traffic through dual 100 Gb/s BlueField-3 links from the InfiniBand training fabric[2]. A 64-node, 512-GPU test exceeded roughly 500 GiB/s aggregate reads and retained 7.94 GiB/s per node, close to the design target of 1 GiB/s per GPU. The configuration and scripts are disclosed, making the result more reproducible than a bare product claim.
Its limit is equally important. The workload simulates observed training access patterns but does not use GPU Direct Storage, and fio bandwidth does not measure model training goodput, metadata-heavy dataset behavior or checkpoint recovery under concurrent fabric faults. The benchmark proves a storage data path under stated conditions.
Nebius: a customer workload and an explicit caution
Nebius reports an anonymous customer’s 3,000-GPU, 375-node production cluster[3]. Peak mean time between infrastructure failures reached 56.6 hours of wall-clock operation, expressed as 169,800 GPU-hours. The average over the preceding several weeks was 33.0 hours. Across most installations, Nebius reports an average mean time to recovery of 12 minutes.
The units need care. Multiplying 56.6 hours by 3,000 GPUs produces 169,800 GPU-hours; these are two expressions of the same failure interval, not two reliability achievements. The peak and several-week average are also different summaries. The post explicitly says that one environment does not generalize to every cluster. This caveat makes the evidence more useful because it identifies the workload boundary.
Nebius describes the operating mechanisms behind the number: multi-stage acceptance tests, active and passive health checks, workload isolation and migration, automated node replacement, state recovery and end-to-end observability. What is not public is the event-level distribution, failure taxonomy, workload goodput and customer-side checkpoint loss. MTBF and MTTR define important pieces, while effective training time also depends on detection delay and lost work per restart.
Lambda: an operating blueprint rather than a benchmark
Lambda’s December 2025 multi-cloud blueprint describes dedicated bare-metal GPU clusters, low-latency networking, S3-compatible storage, managed or self-managed Kubernetes, standard cloud interconnects and Prometheus-based observability[4]. It also claims no ingress or egress fees for data transfer to and from Lambda. The document is a capability and architecture statement aimed at portability across AWS, Azure, Google Cloud and Oracle Cloud.
It does not publish, in that blueprint, a cluster MTBF distribution comparable to Nebius’s customer case or a multi-node storage curve comparable to CoreWeave’s fio study. That absence should not be converted into a claim that the system performs worse. It changes the status of the evidence. A buyer can confirm interfaces, isolation and commercial terms from the document, while sustained collective goodput, recovery behavior and storage scaling require a benchmark, service-level objective or customer workload record.
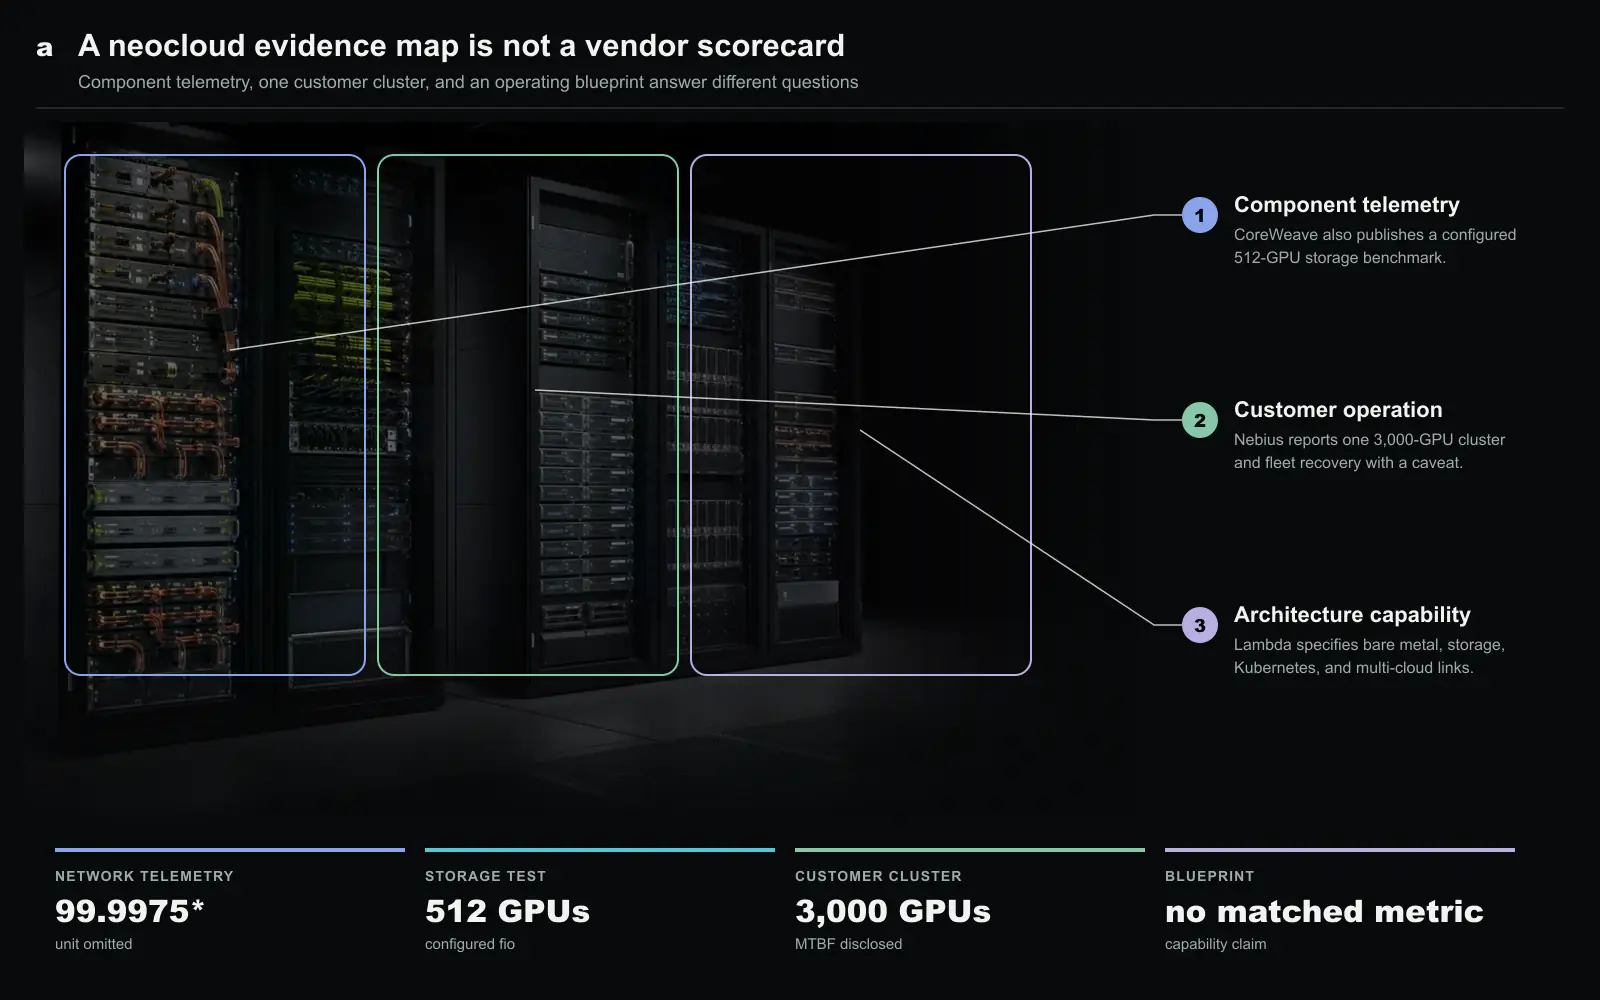
Four labels that prevent a false comparison
Every infrastructure number should carry at least four labels. Subject identifies what was measured: link, storage node, job, cluster or fleet. Workload says whether the input was synthetic, trace-derived, customer production or unspecified. Denominator gives scale and duration. Evidence type distinguishes reproducible measurement, operator telemetry, customer report, modeled projection and capability claim.
With those labels, the disclosures stop competing improperly. CoreWeave’s reported 99.9975 link-readiness figure cannot be compared with Nebius’s 56.6-hour peak cluster MTBF; one samples links at a point and the other counts time between job-affecting infrastructure events. The CoreWeave 500 GiB/s result has a 64-node fio denominator, while Lambda’s S3-compatible storage statement establishes an interface, not a throughput level. Each answers a legitimate but narrower question.
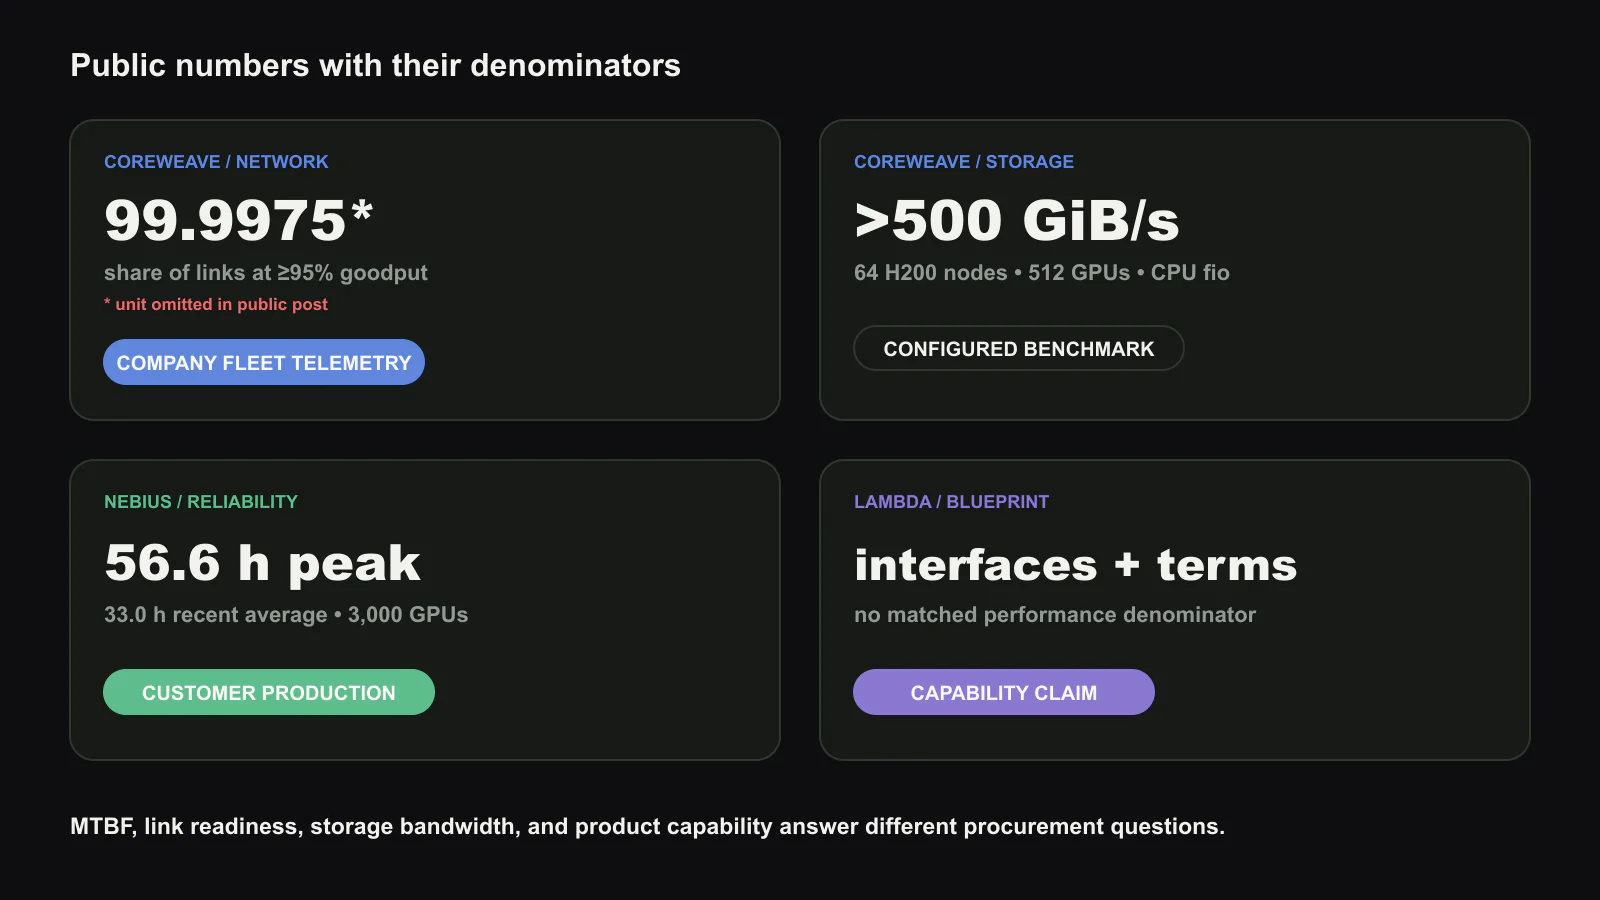
What to request before buying cluster-hours
A procurement evaluation should bridge components to completed work. Run the customer’s model or a representative collective at the intended scale, and report p50 and tail goodput over days rather than one clean hour. Inject or observe node, link and storage failures; separate detection, replacement, communication rebuild, checkpoint reload and lost-step time. Publish both physical availability and scheduler availability, since a healthy spare that cannot join the topology does not restore the job.
Storage should be tested concurrently with training communication and checkpoint bursts. Network results should include path diversity, degraded-mode performance and the fraction of time a job remains below its target collective bandwidth. Commercial portability claims should be exercised by moving artifacts and orchestration between clouds, including measured transfer time and every charge not covered by an egress policy.
The fairest conclusion is not that one neocloud wins. CoreWeave reveals component engineering depth, Nebius reveals a customer reliability interval, and Lambda reveals the portability contract of its stack. The gaps are different. A technically serious buyer turns those gaps into a validation plan rather than filling them with a marketing comparison.
Convert the disclosure into a price for completed work
Component evidence becomes commercially useful only when it changes the unit of purchase. A quoted GPU-hour assumes that every rented hour produces equivalent progress. The disclosed network, storage, and reliability data show why that assumption fails. The buyer ultimately pays for accepted training steps, served tokens within an SLO, or a completed checkpoint. A lower hourly price can be more expensive when collective goodput is unstable, failures erase long intervals, or storage extends every checkpoint pause.
Independent industry analyses reach the same procurement boundary from the cost side. SemiAnalysis frames the target as time to a research objective and models goodput-adjusted cluster cost, while The Next Platform argues that completed training progress should replace raw GPU-hours as the unit of comparison[5][6]. These analyses do not independently validate any provider disclosure reviewed here. They do clarify the missing denominator: price has meaning only after setup, interference, failure and recovery have been charged against accepted work.
The practical metric is risk-adjusted cost per completed unit of work. Its numerator includes rental charges, reserved but unusable capacity, data movement, restart work, and engineering intervention. Its denominator excludes time below the workload’s acceptance threshold. Each provider disclosure can populate one term, but none of the reviewed documents fills the whole equation. That is the analytical reason not to construct a vendor ranking from public numbers: missing variables would dominate the result.
A procurement trial should therefore end with a customer-owned evidence package. It should contain the workload configuration, software versions, topology, percentile goodput, event log, checkpoint and restore distributions, and every exclusion used to compute availability. Repeating the same package after a hardware or software change turns a sales benchmark into an operating baseline. The neocloud market will become easier to compare when providers compete on the completeness of that package, not only on the most favorable number they can disclose.
Contracts should follow the same evidence boundary. A node-availability SLO does not compensate a customer whose distributed job cannot obtain a healthy topology. A network uptime SLO may remain green while collective goodput sits below the training plan. Storage availability can remain green while checkpoint tails erase useful accelerator time. Buyers should request workload-facing service indicators and credits tied to failed job starts, sustained collective thresholds, checkpoint completion, and recovery time. Component indicators remain valuable for diagnosis, but the commercial promise should terminate at completed work.
Comparison over time matters more than a permanent score. Hardware generations, firmware, placement pressure, and customer mix change faster than a procurement cycle. The provider that publishes one strong benchmark may not preserve it under a denser fleet, while an operator with weaker public disclosure may improve rapidly. A buyer should retain the test and rerun it at expansion, renewal, and major software transitions. This makes evidence freshness explicit. A result without a date, version, topology, and load condition is not a durable property of a neocloud; it is an observation whose expiration is unknown.
Evidence should mature with the purchasing decision
An early architecture choice can rely on component disclosures because the question is whether a capability exists. A capacity reservation needs a workload replay because the question is how much useful work the cluster can deliver. A long contract needs operating evidence because availability, maintenance, and performance drift determine cost over months. Reusing the same vendor number at all three stages creates false precision.
We propose an evidence ladder. The first rung verifies physical and software configuration: accelerator model, host, memory, fabric, storage, topology, and software version. The second reproduces a component test with stated concurrency and data placement. The third runs the buyer’s workload or a representative proxy with quality and SLO constraints. The fourth observes repeated jobs across maintenance events and failures. A claim should not move up the ladder merely because it is quoted in more presentations.
This framework is equally important for incumbent clouds. A familiar provider may have more mature operations but still expose a cluster whose network, storage, or scheduling differs from the buyer’s assumption. Neocloud status is not a technical variable. The measurable variables are the delivered system, the evidence behind it, and the contract that assigns risk when performance changes.
The benchmark belongs inside the contract
A pre-purchase benchmark has limited value if the production allocation can differ. The contract should preserve the configuration and measurement method that justified the order. It can specify accepted GPU and host revisions, minimum non-oversubscribed fabric, storage behavior, placement scope, software image, and the workload used for periodic verification. When substitutions are allowed, the provider should demonstrate equivalent completed-work cost rather than equal component labels.
The verification interval depends on what can drift. Hardware topology changes slowly, while firmware, drivers, collective libraries, scheduler policies, and noisy-neighbor pressure can change weekly. A small recurring canary can detect these shifts before a multi-day training job pays for them. The canary should record distributions, not only averages, because a few slow ranks can determine synchronized step time.
Remedies also need to be operational. Credits based on unavailable GPU-hours do not compensate for a run that lost several days before failing. A useful agreement defines when the customer can stop a degraded run, how evidence is collected, whether replacement capacity preserves locality, and who pays for replay. This turns observability from a support feature into part of the purchased service.
Price the completed job, not the accelerator hour
Hourly price is easy to compare and often misleading. The buyer also pays for scaling inefficiency, queueing, checkpoint and restart time, data movement, engineering support, and the probability that a long run must repeat. The denominator should be a completed training milestone or inference workload under a declared quality and latency target.
A simple model can begin with accelerator-hours multiplied by achieved step time, then add expected interruption loss and storage or network charges. It should include reserved but unusable devices when topology fragmentation prevents the requested job shape. This makes apparently idle capacity visible and prevents high nominal availability from masking low schedulability.
The provider can improve the same metric without changing hardware. Better placement, proactive health screening, transparent maintenance windows, fast replacement, and reproducible software images all increase completed work per paid hour. That is why architecture disclosures, customer case studies, and operating blueprints belong in one review even though they are not the same type of evidence.
We read the current neocloud record as sufficient to establish that serious alternatives exist, not sufficient to rank them with one public table. The buyer should use disclosures to construct a test, use the test to write a contract, and use recurring evidence to enforce it. The winner is the platform that repeatedly completes the target work at the promised cost, including the days when a device, link, or release does not behave as planned.
Sources and attribution
This article is an independent analysis prepared by Silicon & Systems from public operator materials published in 2025. Company-reported figures are identified as such, and unlike metrics are not normalized into a ranking. No source text, tables, logos or figures are reproduced; both figures were created for this article. The source materials are CoreWeave’s network post and storage benchmark, Nebius’s cluster reliability report, and Lambda’s multi-cloud blueprint. Copyright remains with the respective publishers.