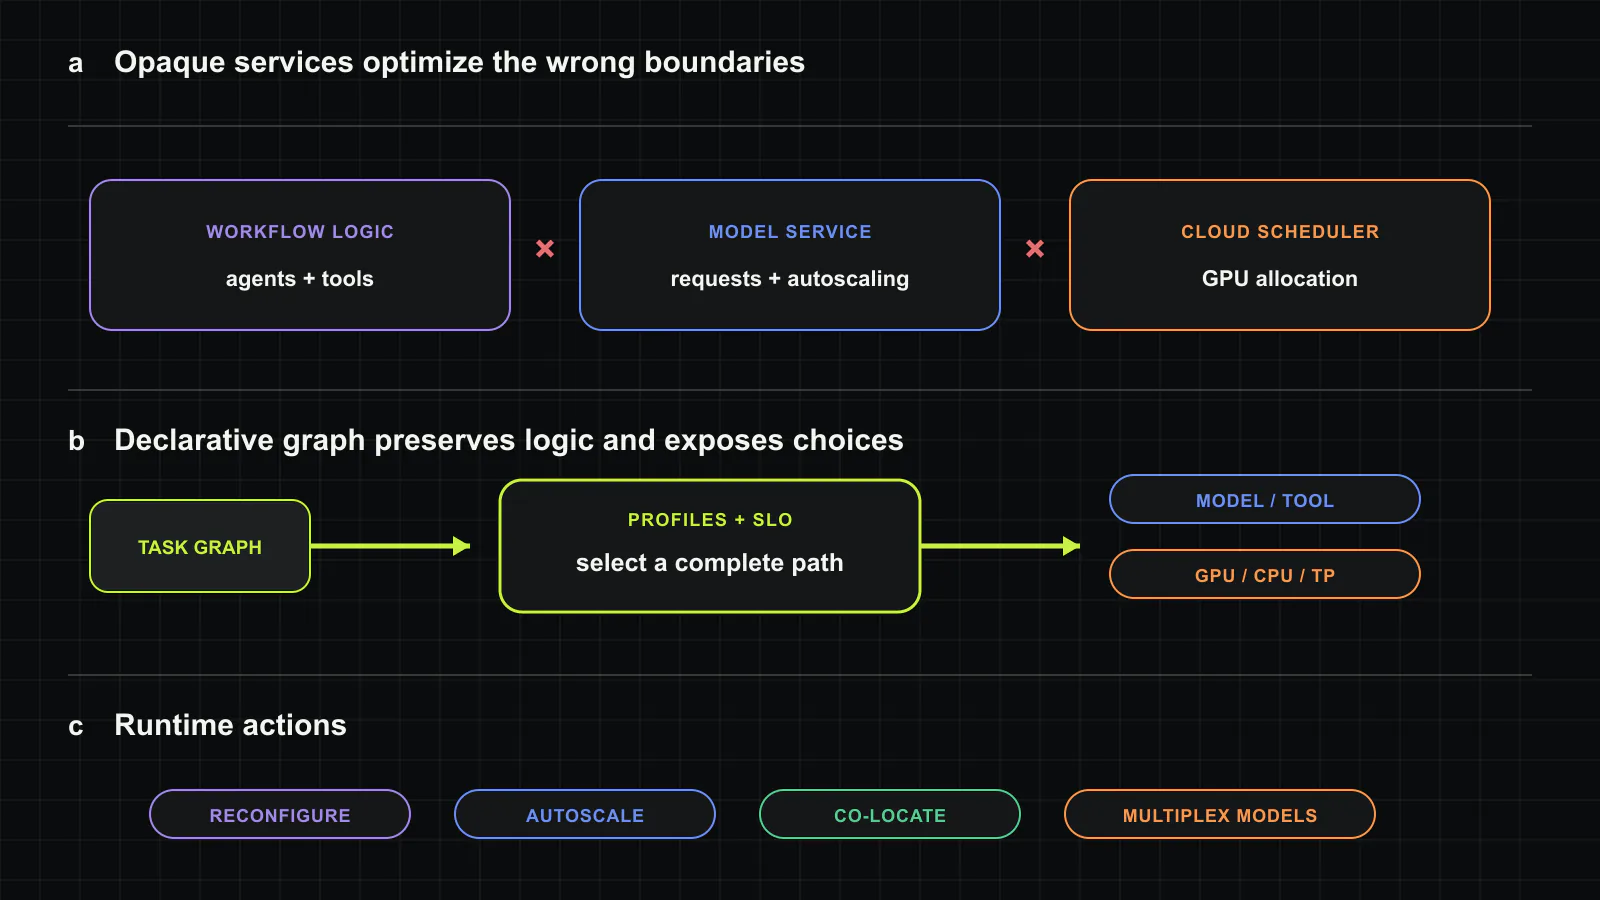
An agent workflow may invoke a vision model, speech recognition, an LLM, a code interpreter, and several debate rounds before it returns one answer. Today’s cloud platform commonly sees those steps as independent API calls. The developer selects models and tools, each model service scales itself, and the cluster scheduler allocates hardware without knowing which calls share one accuracy or latency objective. Murakkab, from MIT CSAIL and Microsoft Azure Research, argues that this separation is the resource problem[1].
The system turns the workflow into a declarative task graph. Logical dependencies remain part of the application, while model choice, tool parameters, tensor parallelism, accelerator type, placement, and capacity become execution choices. An offline profiler maps their accuracy, latency, energy, and cost. An optimizer selects feasible configurations for each service-level objective (SLO), and an adaptive runtime changes them as demand and resources move. The result is not a faster model kernel. It is a cloud control plane with permission to change the entire path that produces the answer.
One workflow creates three coupled configuration spaces
The paper studies video question answering, multi-agent code generation, mathematical problem solving, and a dynamic coding pipeline. Video Q&A includes scene detection, frame extraction, speech-to-text, object detection, and a multimodal model. Code generation runs coder and tester agents through several debate rounds, executes candidates, then lets another model rank the result. Every node exposes a local choice, but local maxima do not form an efficient workflow.
For video Q&A, Gemma-3-27B with ten frames and speech transcription reaches the highest reported accuracy of 66.2% among the profiled configurations, while also producing the most tokens within that model family. For code generation, the best-performing reasoning model produces about 20,000 median tokens. Under an otherwise identical debate structure, Gemma-3-27B produces roughly 2,500. Hardware adds another frontier: A100 and H100 devices at tensor-parallel degrees from one to eight produce different TTFT, throughput, energy, and price points.
These choices are multiplicative. Adding one optional tool does not create one more configuration. It changes downstream token counts, model load, critical-path latency, and which hardware placement can meet the final SLO. An external autoscaler that sees requests per second can resize the selected models, but it cannot decide that speech recognition should move to CPU, that an easy coding request needs fewer candidates, or that two workflows can share one model deployment.
Declarative does not mean unconstrained
Murakkab’s workflow specification describes logical tasks, inputs, outputs, and dependencies. Each task has a set of permitted implementations and parameters. The profiler measures valid combinations rather than allowing the runtime to invent a new workflow. The optimizer then selects from those measured operating points under an objective such as minimum energy or minimum cost, subject to required accuracy and latency.
This distinction matters for trust. A cloud system should not silently replace a high-quality model with a cheaper one unless the application has stated an accuracy tier and the replacement was profiled. Murakkab assigns request SLOs such as best, good, fair, or basic accuracy and separate latency tiers. Requests within the same workflow can therefore receive different configurations. The runtime also assumes the 90th-percentile generated-token load when allocating capacity, providing a buffer against the heavy tail.
The control loop runs at an optimization epoch. In the main production-trace experiment, that epoch is 60 minutes. A new instance carries a modeled 20-minute readiness delay covering cloud VM assignment, environment preparation, and weight movement. Shorter epochs react faster but keep transition capacity alive more often. Longer epochs reduce transition cost but accumulate forecast error. In the sensitivity study, intervals around 60 to 180 minutes form the balanced region, while demand underprediction reaches roughly 15% around 240 minutes before overprovisioning dominates again.
The strongest evidence is the 24-hour resource ledger
The hardware experiments use Azure VMs with eight 80 GB A100 or H100 GPUs. vLLM 0.9 serves LLMs, speaches-ai serves speech recognition, and OmDet provides object detection. Because no production agent-workflow trace was available, the authors map a 24-hour Azure chat and coding inference trace from May 2024 onto the video and code workflows. This preserves demand variation but synthesizes the multi-step workflow behind each arrival.
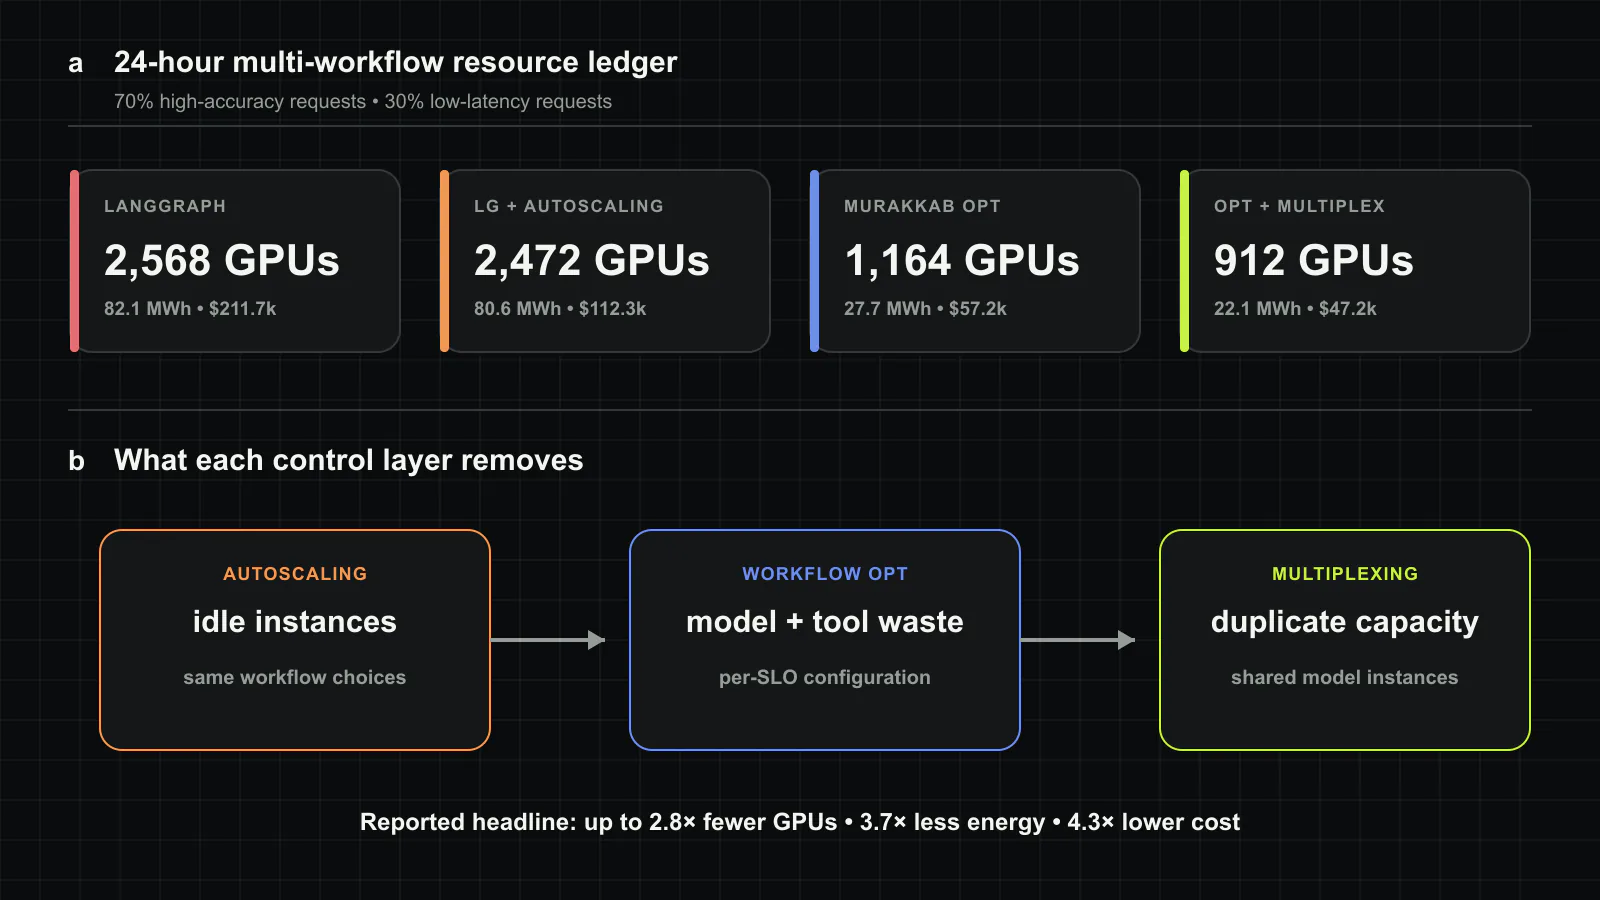
The multi-workflow comparison assigns 70% of requests a high-accuracy objective and 30% a low-latency objective. A hand-configured LangGraph deployment uses 2,568 A100 GPUs, 82.1 MWh, and $211,700. Adding autoscaling reduces the resource count to 2,472 GPUs and cost to $112,300, but keeps the same workflow choices. Murakkab optimizing each workflow separately needs 1,164 GPUs, 27.7 MWh, and $57,200. Joint optimization and multiplexing reduce the totals again to 912 GPUs, 22.1 MWh, and $47,200 while meeting the evaluated SLOs.
Those figures correspond to 2.8× fewer GPUs, 3.7× less energy, and 4.5× lower cost than the hand-configured baseline from the table. The paper summarizes cost as up to 4.3× across its evaluated comparisons, so the public claim should remain 4.3× rather than recomputing a more favorable headline from rounded table values. The important decomposition is that autoscaling alone captures only idle capacity. The remaining savings require changing the workflow and sharing models across requests with compatible SLOs.
A five-GPU schedule explains the abstraction
One experiment asks the system to verify a student’s coding solution from a video within 30 seconds. Video analysis and reference-code generation can run in parallel. Placing object detection, speech recognition, and the LLMs on GPUs uses six A100s and finishes within the SLO, but leaves specialized GPUs underused. Moving both auxiliary models to CPU uses four GPUs, yet object detection saturates the host and misses the deadline. Murakkab chooses the middle point: object detection on one A100, speech recognition on CPU, and Gemma-3-27B on four A100s. Five GPUs meet the SLO because the slower CPU transcription stays off the critical path.
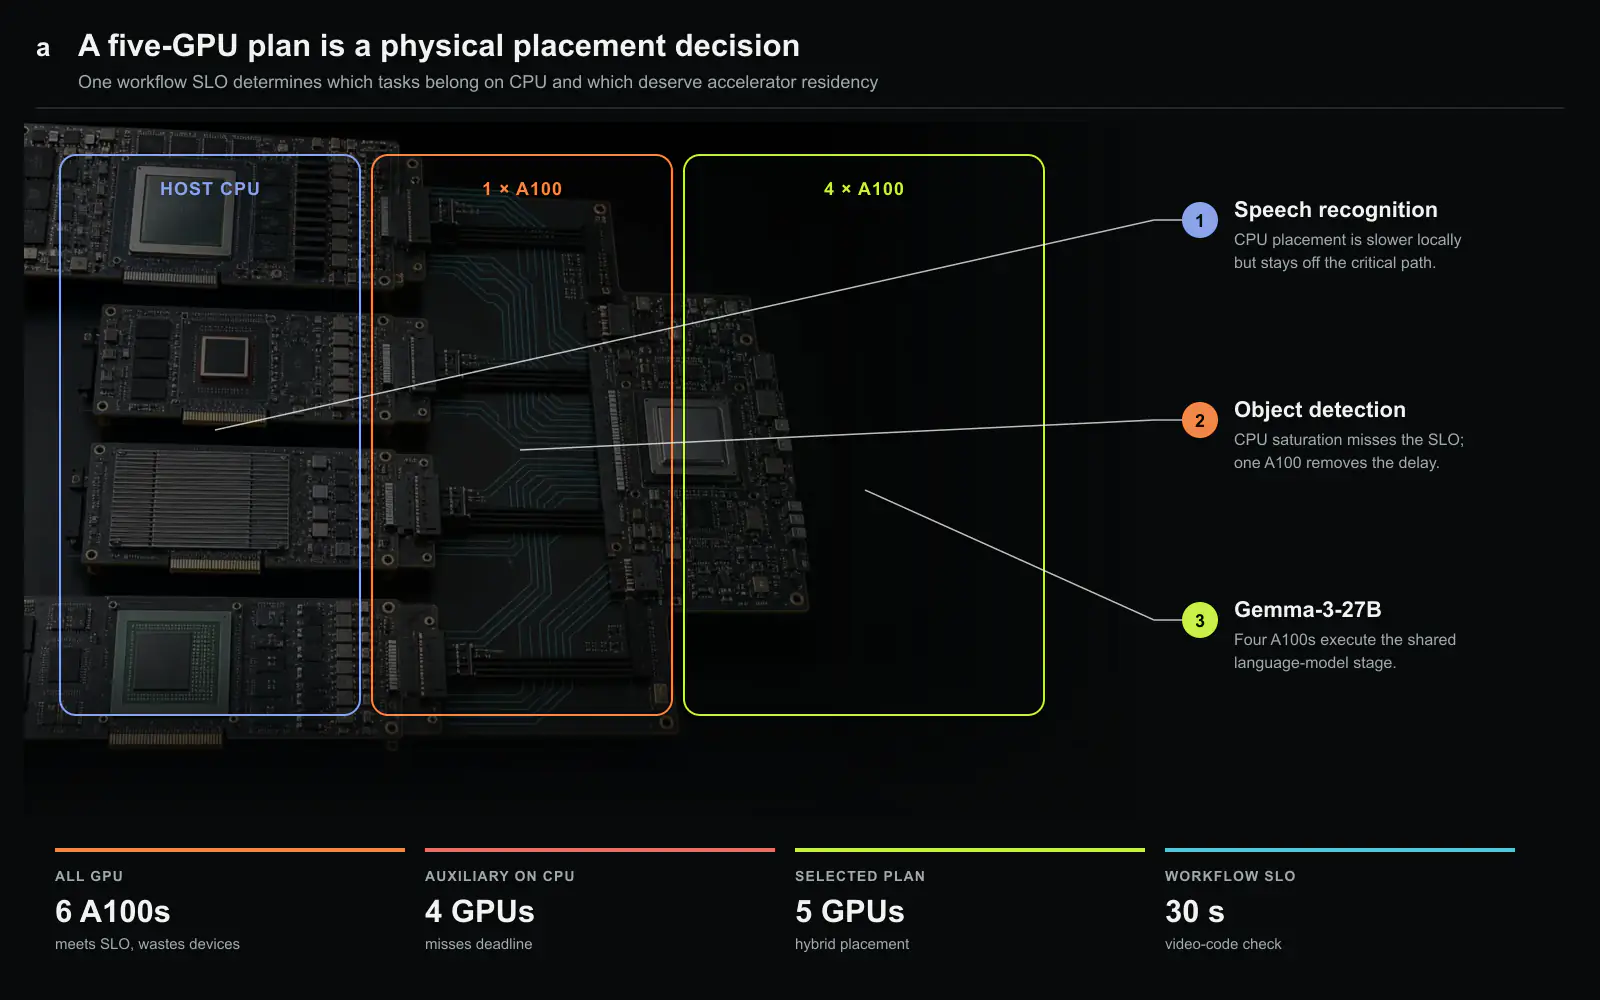
This example is more transferable than the largest percentage. A scheduler needs the dependency graph to know which task can slow down without delaying the answer. Device utilization alone cannot identify that slack. The same principle applies to optional review stages in coding agents. On LiveCodeBench, a review step improves some model and problem combinations but reduces accuracy in others. Static agent templates either overspend on easy tasks or withhold useful work from hard ones.
The result depends on provider-level authority
Murakkab assumes one entity can profile models, deploy them on chosen hardware, inspect workflow structure, and reconfigure execution. An application assembled from external APIs may not expose power, batching, tensor parallelism, instance placement, or model sharing. In that environment, the declarative graph helps with application logic but cannot reproduce the paper’s infrastructure savings.
The evidence also has boundaries. The arrival trace comes from single-model chat and coding services, then receives synthetic agent graphs. The principal workflows and models are a curated set on A100 and H100 VMs. Profile transfer is tested between two mathematics datasets from a similar domain; large distribution shifts could change accuracy or token-load ordering. Cost depends on the paper’s Azure prices and the assumed 20-minute provisioning time. These are inputs to the optimizer, not universal constants.
The next agent platform needs an optimization contract
Operators should require four things before attempting this design. The workflow must expose tasks and dependencies without hard-coding one model. Each alternative must have quality and resource profiles on representative inputs. Users must state which objective may move and which SLO may not. Finally, the platform must record every runtime substitution so that a cheaper answer is still auditable.
Murakkab’s lasting point is that agent efficiency cannot be reduced to tokens per second at one endpoint. The sellable unit is an answer that satisfies a workflow-level quality and latency contract. Once the graph, profiles, and resources share one control plane, the cloud can spend expensive models only where they change that answer.
Quality constraints must be executable
A declarative workflow can list a quality objective, but the platform still needs a test that decides whether one model, tool, or control path may replace another. Offline benchmark accuracy is only a starting point. Agent steps depend on earlier outputs, and a substitution can change later prompts, tool calls, retries, and termination. The effect must be evaluated at the workflow result as well as the local task.
Each alternative should therefore carry an evaluation set, metric, confidence interval, and domain label. Safety or policy constraints may be hard rather than optimizable. The runtime can explore cost and latency only among configurations that pass those gates. When evidence is weak or an input falls outside the profiled domain, the system should choose a conservative configuration instead of extrapolating a cheap path.
Online feedback needs protection from circular measurement. User engagement or completion can be influenced by latency and presentation, not only answer quality. A platform that optimizes a blended score may learn to prefer faster but less reliable workflows. Periodic human or trusted-model evaluation, counterfactual replay, and versioned test sets can keep the quality constraint anchored.
Profiles have a shelf life
Murakkab’s optimizer depends on profiles of model quality, latency, energy, cost, and resource use. Providers update models, prices, batching, and quotas. Self-hosted stacks change kernels, hardware health, and contention. Input distributions and tool behavior also drift. A profile should therefore include its timestamp, software and model version, workload domain, sample count, and prediction error observed in service.
The runtime can compare expected and observed latency, token use, quality proxy, and resource consumption for each task. Persistent deviation should lower confidence and trigger bounded reprofiling. Reprofiling every option continuously would consume the savings, so the system should prioritize alternatives near a decision boundary or responsible for a large fraction of cost.
Provisioning delay creates another clock. A configuration that is cheapest after an instance becomes ready may be expensive for a short burst. The optimizer must price warm capacity, cold-start time, minimum billing interval, and the likelihood that the resource remains useful for other workflows. This turns instance selection into a lifecycle decision rather than a static price lookup.
Multi-tenant optimization requires isolation
Sharing models and hardware across workflows can raise utilization, but one tenant’s burst can alter another tenant’s latency and even its chosen configuration. The SLO contract should state whether the optimizer may substitute models, colocate tasks, reuse warm instances, or delay optional steps across tenants. Sensitive inputs and outputs must remain within declared data boundaries even when the physical executor is shared.
Resource controls should cover GPU memory, compute, host memory, network, and external API quotas. A colocated tool or model can create tail latency through a shared resource that the GPU scheduler does not see. Per-workflow accounting needs the resource consumed by retries and speculative branches, because agent graphs can amplify one request into many operations.
Fairness should be measured in completed workflow outcomes. A high-priority workflow may preempt a lower-priority model call, but repeated preemption can cause the lower workflow to restart or miss an external tool deadline. Admission control can reserve end-to-end budgets before starting a graph and avoid launching branches that cannot finish within the remaining SLO.
Every substitution needs an audit trail
Agent workflows can affect code, business processes, and user decisions. The platform should record the logical workflow version, selected model and tool for each node, configuration, input and output references allowed by policy, profile version, optimization objective, and reason for each runtime change. This record enables reproduction without exposing private payloads more broadly than necessary.
Audit is also how operators distinguish optimizer failure from model or tool failure. If cost rises, the record can show whether the chosen configuration behaved differently from its profile, a branch expanded unexpectedly, or capacity was unavailable. If quality falls, it can identify which substitution changed the path. A global average cannot provide this attribution.
Rollout should begin with workflows whose alternatives have clear quality tests and whose side effects are reversible. The system can first recommend configurations, then control self-hosted resources, and only later substitute external models or tools. Each stage should compare savings with SLO attainment, quality, rollback rate, and engineering effort.
We read Murakkab as a proposal for an optimization contract between agent developers and cloud infrastructure. The graph exposes what can vary, profiles state the evidence, SLOs set the non-negotiable outcomes, and the runtime chooses resources. The contract becomes deployable when quality tests, profile freshness, isolation, and an audit trail constrain that freedom as carefully as the optimizer exploits it.
Source and attribution
This article is an editorial summary prepared by Silicon & Systems. It restates the cited paper’s mechanisms, evaluation conditions, results, and limitations in our own words. No sentences, tables, or figures from the paper are reproduced; all three figures and the card image were created for this article from reported facts. Copyright (c) 2026 the authors. The paper is publicly available through the USENIX OSDI 2026 page.