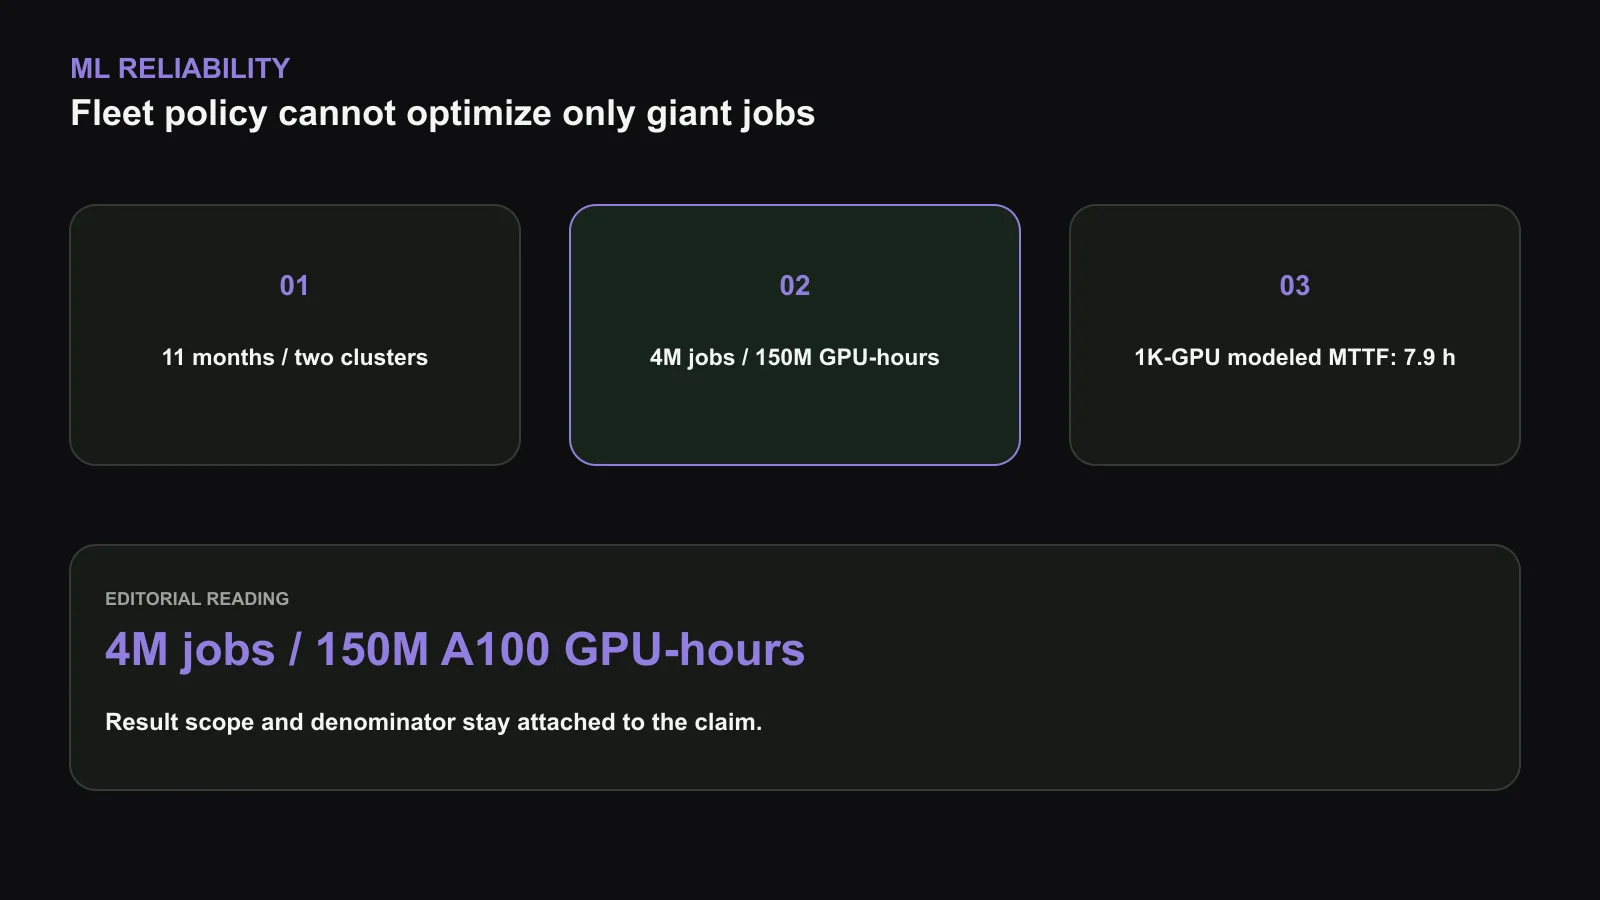
Reliability work often starts from the largest training run because its failure probability is easiest to see. Meta’s eleven-month study covers two clusters, four million jobs, and more than 150 million A100 GPU-hours, then shows why that focus is incomplete[1].
Fleet policy must optimize two distributions at once: the chance that each job finishes and the GPU time lost when it does not. The paper is worth reading because it connects failures, checkpoint time, queueing, and second-order preemption through Effective Training Time Ratio rather than treating incident count as the objective. This review uses that denominator to separate observed fleet behavior from projections for jobs larger than the measured population.
Job size changes both risk and impact
Jobs using at least 4,000 GPUs were fewer than 1% of submissions but consumed 12% of GPU resources. The fitted model gives a 1,024-GPU job a mean time to failure of 7.9 hours. Extrapolation makes still larger jobs increasingly checkpoint-bound. However, small jobs dominate count and can be preempted or delayed when large jobs fail and restart. The study attributes 16% of total failure overhead to these second-order effects.
The paper uses Effective Training Time Ratio (ETTR), useful training time divided by total occupied time, to connect failure rate, checkpoint interval, restart cost, and queue delay. For a projected 12,288-GPU run, reaching about 0.9 ETTR requires either checkpoint writes near ten seconds or a material reduction in failure rate. Health checks reduced failures for jobs above 512 GPUs from 14% to 4% in one reported intervention.
A scheduler log reveals a different population from a case study
The data covers four million jobs rather than a collection of famous training runs. Most submissions are small experiments, evaluation jobs, data preparation, or development steps. Large jobs consume a disproportionate share of GPU-hours but remain rare by count. Reliability policy must therefore optimize two distributions at once: the probability that a submitted job completes and the amount of scarce capacity lost when it does not.[1]
Eleven months is long enough to include software updates, hardware aging, workload growth, and operational interventions. It is also short enough that the fitted rates should not be treated as permanent hardware constants. The two clusters may differ in topology, maintenance, utilization, and job mix. The useful artifact is the method of joining scheduler state, failure records, and occupied GPU time, then testing how conclusions change by size and duration.
Raw “failed job” counts are insufficient. A user cancellation, application bug, preemption, host problem, GPU error, and network fault have different owners and remedies. The taxonomy must also distinguish an initial cause from the scheduler actions that follow it. Otherwise, one physical event can appear as many job failures or a user retry can be counted as a new independent fault.
Scale multiplies exposure, not only component count
If every GPU and link had an independent constant failure rate, adding devices would shorten job MTTF approximately in proportion to the exposed components. Real clusters complicate that intuition. Devices share hosts, switches, power, cooling, firmware, and software. One fault can remove several ranks, while a correlated event can invalidate the independence assumption behind a simple projection.
The fitted 7.9-hour MTTF for 1,024 GPUs is therefore an operating estimate for the observed environment. It combines the hardware population, workload duration, detection policy, and definition of failure. Extending the curve to 12,288 GPUs helps expose the checkpoint problem, but the further the extrapolation moves beyond observed job sizes, the more confidence depends on unchanged correlation and repair behavior.
Job duration matters as much as width. A short, wide evaluation may finish before the expected failure interval, while a narrower job running for weeks accumulates comparable exposure. Capacity planners should model completion probability over the intended duration and include planned maintenance, software rollout, and time-varying hazard rather than ranking jobs by GPU count alone.
ETTR gives all lost time one denominator
Mean time to failure describes how often progress is interrupted but not how costly the interruption is. ETTR divides useful training time by the total time for which resources are occupied. Time spent writing checkpoints, waiting for allocation, diagnosing a fault, restarting processes, restoring state, and recomputing lost steps can all reduce the ratio.
Two clusters with the same MTTF can have different ETTR. One may identify a failed node within seconds and restore a distributed checkpoint quickly; the other may hold healthy GPUs during diagnosis, release the job, wait in a queue, and reload slowly. Conversely, a system with more frequent faults can maintain acceptable ETTR if checkpoints and recovery are sufficiently fast.
The metric should be reported with the useful-work definition. A step that later must be discarded is not useful, and a GPU allocated to a stalled rank is not training. Data-loading warm-up, validation, or compilation may be necessary for the job but still belong in occupied time when the objective is cluster capacity. Clear accounting prevents teams from moving overhead outside a narrow training timer.
Checkpoint interval is an optimization, not a slogan
Frequent checkpoints reduce the expected computation lost after a failure but consume I/O bandwidth and can stall training. Infrequent checkpoints preserve steady-state throughput yet enlarge the rollback. The optimum depends on failure rate, write duration, restore duration, storage contention, and whether checkpoint work overlaps computation.
The projected 12,288-GPU case makes the constraint visible. To approach 0.9 ETTR at the modeled reliability, checkpoint writes need to complete around ten seconds unless failure frequency falls materially. That number is a scenario result, not a universal requirement for every model. State size, sharding, optimizer, storage topology, and compression all change it.
A fleet also needs aggregate checkpoint capacity. If several large jobs save at the same cadence, synchronized bursts can overload storage and make each checkpoint slower, creating the condition the model assumed away. Schedulers can stagger writes, reserve bandwidth, use hierarchical local and remote tiers, and measure restore as carefully as save. A checkpoint that writes quickly but takes minutes to find and reload does not protect ETTR.
Health checks can buy more than faster storage
The reported intervention reduced failures among jobs above 512 GPUs from 14% to 4%. Screening nodes before allocation and detecting degraded components before a large run starts can improve the numerator of the reliability problem rather than only reducing recovery cost. This can be more valuable because one avoided failure saves checkpoint, diagnosis, queue, and recomputation time together.
Health checks have their own false-positive and coverage trade-offs. A strict test can quarantine healthy GPUs and lower available capacity; a shallow test may miss intermittent NVLink, memory, or thermal faults that appear only under sustained load. Tests should reflect the failure classes seen in production and record why a node was removed, which test cleared it, and whether it failed again after return.
The scheduler can use confidence rather than a binary label. Nodes with uncertain health may serve small, restartable jobs while the highest-confidence pool is reserved for long, wide training. This creates a reliability-aware placement policy, provided it does not strand so much hardware that queue time erases the benefit.
Second-order loss is a cluster effect
When a large job fails, its immediate wasted work is only the first cost. Restarting may preempt smaller jobs to recover a contiguous allocation. Released and reacquired nodes can fragment the schedule. Checkpoint traffic competes with unrelated jobs, and repeated diagnosis occupies operators and test capacity. The study attributes 16% of failure overhead to such secondary effects.
This share explains why a locally rational policy can reduce global output. Giving a flagship run absolute priority minimizes its restart delay but may repeatedly evict hundreds of experiments. Allowing it to wait can preserve small-job completion while leaving thousands of GPUs fragmented. The scheduler needs an objective that prices useful GPU-hours across job classes, deadlines, and restart costs.
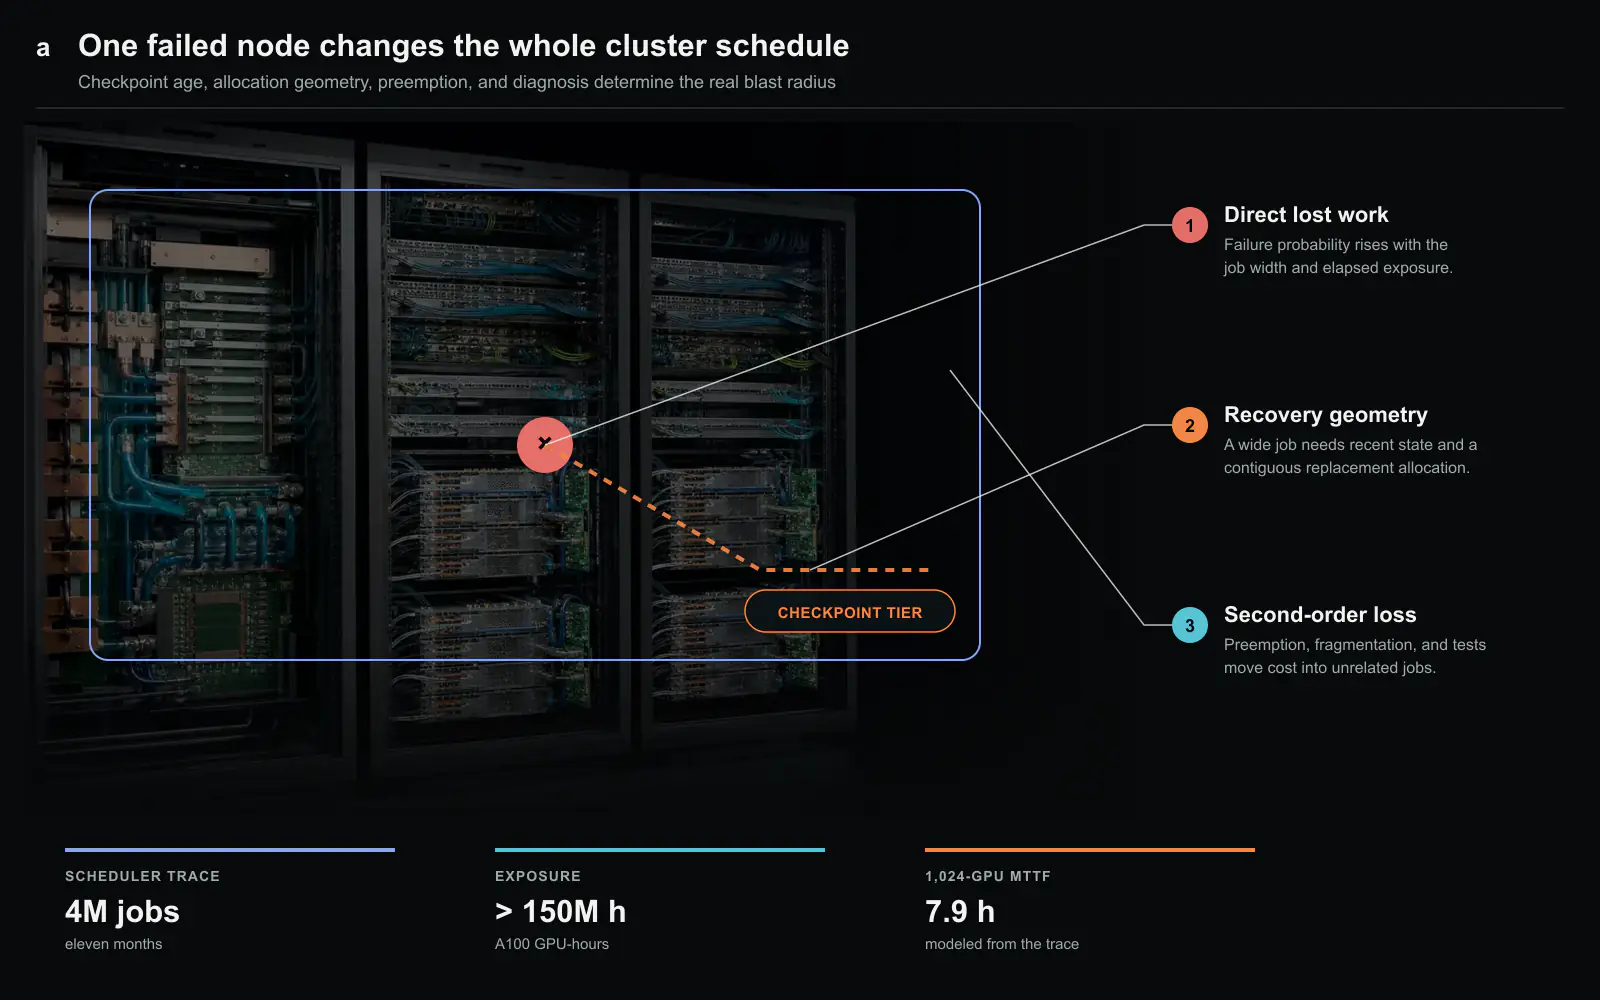
Preemption policy should know checkpoint age. Evicting a small job that has not saved recent state can destroy more useful work than delaying the large job briefly. Backfilling should account for predicted repair time and allocation geometry. Reliability and scheduling cannot be separate control loops because every recovery action changes the queue.
Failure categories point to different investments
Hardware replacement is appropriate for persistent device and link faults, but application errors need better validation and user tooling. Software infrastructure faults may require safer rollout or version pinning. Network congestion that appears as a timeout calls for diagnosis and topology-aware scheduling, not a new GPU. A single aggregate failure rate hides these choices.
The cost model should multiply each category’s frequency by affected GPU count, time to detect, time to repair, checkpoint age, and secondary disruption. This converts anecdotes into an investment ranking. Faster fault localization can outperform redundant hardware when diagnosis dominates, while local checkpoint storage is valuable when restore bandwidth is the limiting term.
Trends matter after intervention. If health screening lowers device failures, application and scheduler causes may become the largest remaining losses. The taxonomy and dashboards must remain stable enough to reveal that shift rather than declaring the reliability project complete after one percentage improves.
Research clusters have a distinct objective
A production training service may repeat a small set of validated workloads. A research cluster runs changing code, new kernels, unusual model shapes, and experiments expected to fail. Treating every application failure as an infrastructure defect would quarantine healthy machines and suppress experimentation. Ignoring application behavior would waste capacity and make real hardware faults hard to isolate.
The platform therefore needs fast feedback to users and clear responsibility boundaries. Preflight tests can catch invalid distributed configurations before a large allocation. Small-scale canaries can run new code before it expands. Failure reports should identify the first anomalous rank and relevant system evidence without exposing other users’ data.
Success is total research progress, not the uptime of one job. Metrics can include completed experiments, useful GPU-hours, time to first result, large-job ETTR, and queue delay by size. This portfolio view is the central reason the paper’s millions of jobs matter.
What another operator should reproduce
Begin with a joined event record: submission, allocation, start, checkpoint, anomaly, diagnosis, release, restart, completion, and the physical resources involved. Define failure categories and useful time before fitting a model. Report observed ranges separately from extrapolated ones and test sensitivity to correlated events.
Then calculate ETTR by job size, duration, and workload class. Measure save and restore distributions under concurrent checkpoint load, not only one isolated write. Quantify secondary loss from preemption and queue changes. Run health-check interventions as controlled cohorts where practical so workload drift is not mistaken for reliability improvement.
Lastly, make policy reversible. Quarantine thresholds, priority rules, and checkpoint cadences should be versioned and evaluated over time. A reliability model is a controller input whose assumptions will age as the fleet, software, and job portfolio change.
Limits of the evidence
The measurements describe two Meta research clusters dominated by A100-era infrastructure. Other accelerators, interconnects, checkpoint formats, and scheduler policies can shift every parameter. The projected behavior of a 12,288-GPU job is a model-based scenario, not a measured run at that size.
The data nevertheless supports a durable conclusion. Component reliability, recovery speed, checkpoint design, and scheduler externalities share one denominator: useful work produced by occupied resources. Optimizing only MTTF or only the largest job misses that system objective.
Reliability investment should be evaluated at the margin
An operator choosing between faster checkpoints, more spare nodes, stronger health tests, redundant network paths, or better diagnosis can apply the same ETTR model to each proposal. Estimate which failure categories it changes, how much detection or recovery time it removes, which job sizes benefit, and what new capacity cost it creates. The preferred project is the one that returns the most useful GPU-hours per unit of capital and operational effort.
The calculation should include confidence. A checkpoint upgrade has a measurable write and restore distribution; a projected hardware failure reduction may rely on sparse events. Controlled rollout and before-after cohorts can update the estimate. Interventions can interact, so adding their independent savings may double count the same lost interval.
User experience belongs in the model as well. Faster feedback from a failed experiment can be valuable even when GPU-hours saved are modest, while repeated preemption can destroy research continuity without appearing as infrastructure downtime. A balanced scorecard should retain both fleet efficiency and completion behavior by job class.
Capacity forecasts should preserve uncertainty rather than returning one ETTR. Bootstrap intervals from observed events and sensitivity to correlated failures show whether a procurement choice is robust. If two interventions overlap within uncertainty, operational simplicity and reversibility may be more important than the point estimate.
The model should also be recalculated after major scheduler, checkpoint, or hardware changes. Once an intervention shifts the failure mix, historical parameters no longer describe the controller it helped create. Continuous validation keeps ETTR a decision tool rather than a retrospective statistic. Publishing the assumptions and data window internally also lets users understand why priority or checkpoint policy changed and challenge a model that no longer matches their jobs. That transparency helps reliability policy remain a shared capacity decision instead of an opaque scheduler penalty.
What we take from it
MTTF alone cannot guide a shared research cluster. Operators need ETTR, job mix, preemption cascades, and the time needed to identify unhealthy nodes. Hardware redundancy, scheduler policy, checkpoint systems, and debugging tools therefore share one reliability budget. The important operational conclusion is that optimizing a heroic training run while destabilizing thousands of small experiments can reduce total research output.
Capacity planning should use job completion probability
Fleet reliability becomes an allocation problem when one job occupies enough devices that some component is likely to fail before the next checkpoint. Average device availability cannot represent this condition. A planner needs the requested GPU count, duration, checkpoint cost, restart scope, and correlated failure domains to estimate the probability that useful progress survives the reservation. The same device fleet can support many short jobs reliably while repeatedly interrupting one large synchronous job.
Small jobs still matter because they compete for the healthy shapes, spares, network paths, and maintenance windows that large jobs require. Packing them into fragments can improve nominal utilization, but poor placement can remove the contiguous capacity needed for recovery. Operators should therefore report completed job-hours by size class together with reserved spares and replayed work. This metric exposes whether reliability policy raises total useful work or simply transfers delay from the largest jobs to the rest of the queue.
Source and attribution
This digest uses independent wording and two newly created figures. It reproduces no source prose, figure, or table. The public preprint is available on arXiv; the proceedings version is © IEEE 2025.