Large-model training fails slowly more often than it fails cleanly. One GPU may throttle, a PCIe path may degrade, a dataloader may stall, or a configuration may make one collective participant late. The job remains alive, so a health check passes. Synchronization then turns one local delay into idle time across every rank. A dashboard can show the symptom without identifying the offending device, link, function, or line of code.
EROICA addresses the gap between two familiar tools. Fleet monitoring samples counters cheaply and covers all hosts, but its seconds-scale summaries cannot explain short function-level anomalies. Offline profilers record Python calls, CUDA kernels, communication events, and hardware samples in detail, but the paper notes that Torch Profiler can produce more than 100 MB per worker per second. Capturing that stream continuously across tens of thousands of accelerators would create a new infrastructure problem. EROICA therefore does not try to make full traces cheaper. It changes what must be retained and compared.
The mismatch between coverage and explanation
Traditional alerting begins with a component. GPU utilization fell, a NIC counter moved, or a host reported an error. Training performance begins with a synchronized step. The same slow iteration can originate in user code, framework configuration, CPU contention, GPU frequency, memory, NVLink, PCIe, a NIC, the fabric, or remote storage. A component dashboard also struggles with mixed failures, such as a network defect that changes the runtime behavior of a communication function.
The production incident sample in the paper makes this breadth concrete. Across roughly 100,000 GPUs over nine months, 44.4% of observed performance issues were attributed to hardware and 48.2% to software. Existing online techniques could root-cause only 29.6% of the incidents considered by the authors. The missing information was not another fleet average. It was the identity and behavior of the function in which workers stopped looking alike.
EROICA activates synchronized profiling after a global slowdown detector fires. It collects function execution events for GPU compute, memory operations, and communication, alongside higher-rate samples from CPUs, memory, GPUs, NVLink, PCIe, and networking. This is still detailed observation, but it is demand-triggered and bounded. The system then summarizes the stream locally before fleet-wide analysis.
Behavior patterns instead of raw event archives
The central abstraction is a runtime behavior pattern for causally related training functions. A pattern records compact statistics such as execution time and hardware behavior instead of preserving every timestamp. Functions on the critical path can then be compared across ranks. Most workers in a healthy synchronized job execute the same phase under similar conditions. A hardware or software problem usually creates a difference in either the function duration, the attached hardware signature, or both.
This differential approach avoids a requirement that would be brittle at cluster scale: perfectly aligned clocks. The paper notes that NTP error can be around 10 ms, while relevant functions may execute at millisecond or microsecond scale. Comparing absolute event timestamps across hosts would confuse clock error with program order. EROICA instead uses local causality and cross-worker differences in summarized behavior. The healthy majority becomes a contemporaneous reference for the suspected worker.
The method also reduces the amount of information that must leave each host. Hardware counters can be sampled at rates from 10 kHz to 200 kHz in the system’s diagnostic modes, while selected software observations are represented at a lower effective rate. The paper’s design point is not a single universal sampling frequency. It is to retain enough structure to distinguish a slow function without continuously exporting the raw profiler stream.
From an outlier to a root cause
A useful diagnosis needs more than ranking slow workers. EROICA links an abnormal pattern back to the function and the hardware evidence observed during its execution. A ring all-reduce that is slow only on workers using one downgraded network bond suggests a link problem. A GEMM that lengthens while GPU frequency or occupancy changes points elsewhere. A dataloader delay with CPU contention leads to a different operator action than a communication slowdown with normal host counters.
The paper presents production cases spanning network degradation, GPU throttling, host services that contend for resources, framework configuration, and user code. That diversity is important because a classifier trained only on labeled device faults would miss software defects, while a source-code profiler without physical telemetry would misclassify hardware-induced slow functions. EROICA combines the two evidence planes after it has narrowed the search to the abnormal execution region.
Its output can feed an assistant that proposes remediation for simple code and configuration problems. That final automation should not be confused with the diagnostic result. The evidence-producing step is the function and device localization. A generated fix still needs change control, workload-specific validation, and rollback, especially when a suggestion alters parallelism or communication behavior.
What 97.5% establishes
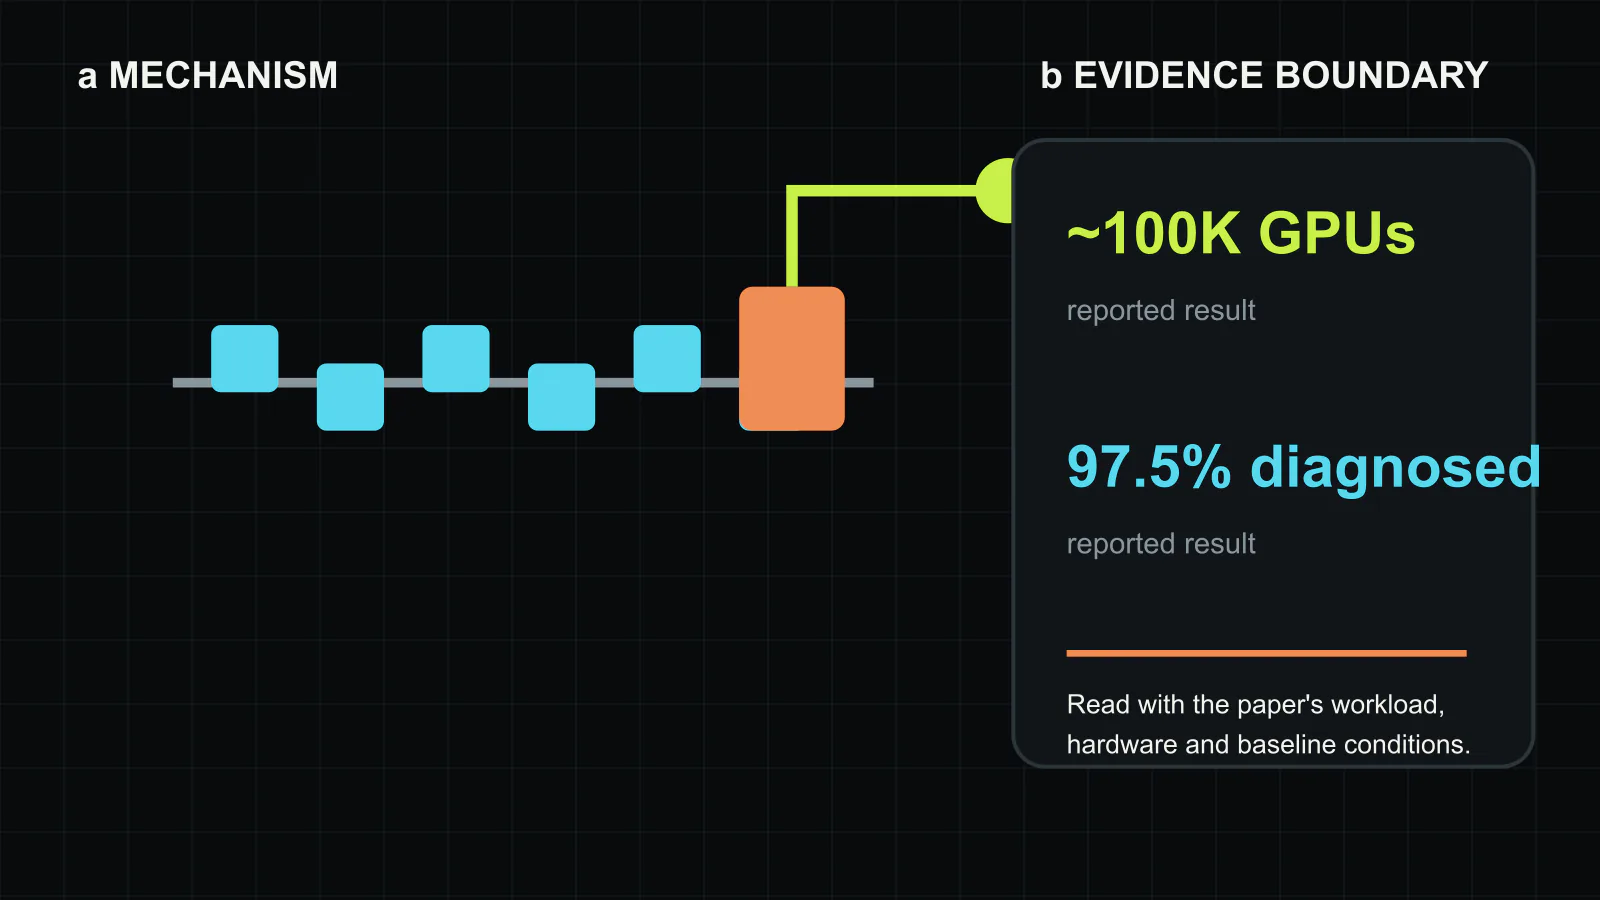
EROICA ran as a production service for about 1.5 years in clusters totaling roughly 100,000 GPUs. The authors report successful diagnosis for 97.5% of the difficult performance issues in their evaluated set. This is an operational result, not a synthetic fault-injection accuracy on a fixed benchmark. It shows that the representation covered a wide range of incidents under one large operator’s software stack and procedures.
The percentage does not by itself specify time-to-diagnosis, false-alarm cost, or performance recovered per incident. It also reflects the incident-selection and ground-truth process used by Alibaba Cloud. Another operator may run different frameworks, accelerators, network topologies, and host agents. A deployment decision should therefore request the incident denominator, categories, unresolved cases, profiling trigger policy, and the delay between alert, localization, and corrective action.
The design still transfers even when the production percentage does not. Synchronous workers provide a natural comparison group; function boundaries connect program behavior to hardware; demand-triggered detail limits steady-state cost; local summarization limits data movement. These properties remain useful for PyTorch, JAX, Megatron, or an internal runtime, although each environment requires new instrumentation and diagnosis rules.
The observability budget that matters
Fleet operators often compare telemetry systems by sample rate, retention period, or dashboard count. EROICA suggests a better budget. The first quantity is coverage: what fraction of active workers can be observed when an incident occurs? The second is resolution: can the system identify a function and component rather than only a host? The third is interference: how much training progress is lost while collecting evidence? The fourth is diagnosis yield: what share of real incidents reaches an actionable root cause?
Those metrics expose tradeoffs hidden by a larger data lake. Retaining every event improves retrospective flexibility but can delay analysis and consume network and storage capacity. Sampling too aggressively keeps cost low but erases short anomalies. EROICA chooses a middle path in which global detection triggers a brief, synchronized increase in detail and each host reduces the result before comparison.
The trigger is therefore part of the reliability design. If detection fires late, the abnormal state may disappear before profiling begins. If it fires too often, the demand-triggered profiler becomes continuous overhead. Operators need a replayable policy for thresholds, duration, cooldown, and the set of jobs eligible for profiling. They also need privacy and tenancy controls because call stacks and source locations can reveal customer code.
A practical deployment contract
An independent implementation should begin with a failure taxonomy taken from its own incident history. For each class, the team should name the shortest observation that separates plausible causes. GPU frequency and SM activity may separate thermal throttling from a slow input stage. Per-function NIC throughput may distinguish a collective library problem from a physical link. CPU and storage samples may reveal a checkpoint or dataloader bottleneck. Instrumentation that cannot change an operator decision should not be collected merely because it is available.
The system should also preserve a small raw-data escape hatch. Compact patterns are powerful because most workers follow the same computation, but unusual asynchronous workloads or heterogeneous expert routing may not produce a stable majority. Keeping bounded traces for the suspected ranks allows engineers to challenge the summary when the workload itself is asymmetric. Diagnosis confidence should fall when there is no valid peer group.
Finally, success should be measured in recovered GPU time. A root cause label is valuable only if it shortens mitigation or prevents recurrence. Linking the diagnosis record to ticket resolution, configuration changes, and subsequent training efficiency turns observability from a monitoring expense into an operational control loop.
The system decision
EROICA’s strongest claim is not that one operator reached a 97.5% success rate. It is that large training jobs contain their own reference population. Workers executing the same synchronized phase let the observability system compare compact behavior instead of shipping a complete trace from every machine.
For an AI infrastructure team, the procurement question becomes precise: can the telemetry stack move from a slow iteration to the exact function and physical component while the job is still running? If it can only produce utilization graphs, the expensive part of the incident remains manual. If it can preserve function causality, compare peers, and expose the relevant hardware signature within a controlled collection budget, a 100,000-GPU fleet becomes diagnosable without turning every worker into a permanent profiler.
Source and copyright note
This article is an independent editorial digest of the NSDI 2026 paper[1]. The prose and figure were created anew for Silicon & Systems; no paper figure or table was reproduced. Measurements are reported with the authors’ production scope and should not be generalized without a local incident audit. Copyright in the original work remains with its authors and the USENIX proceedings (2026).