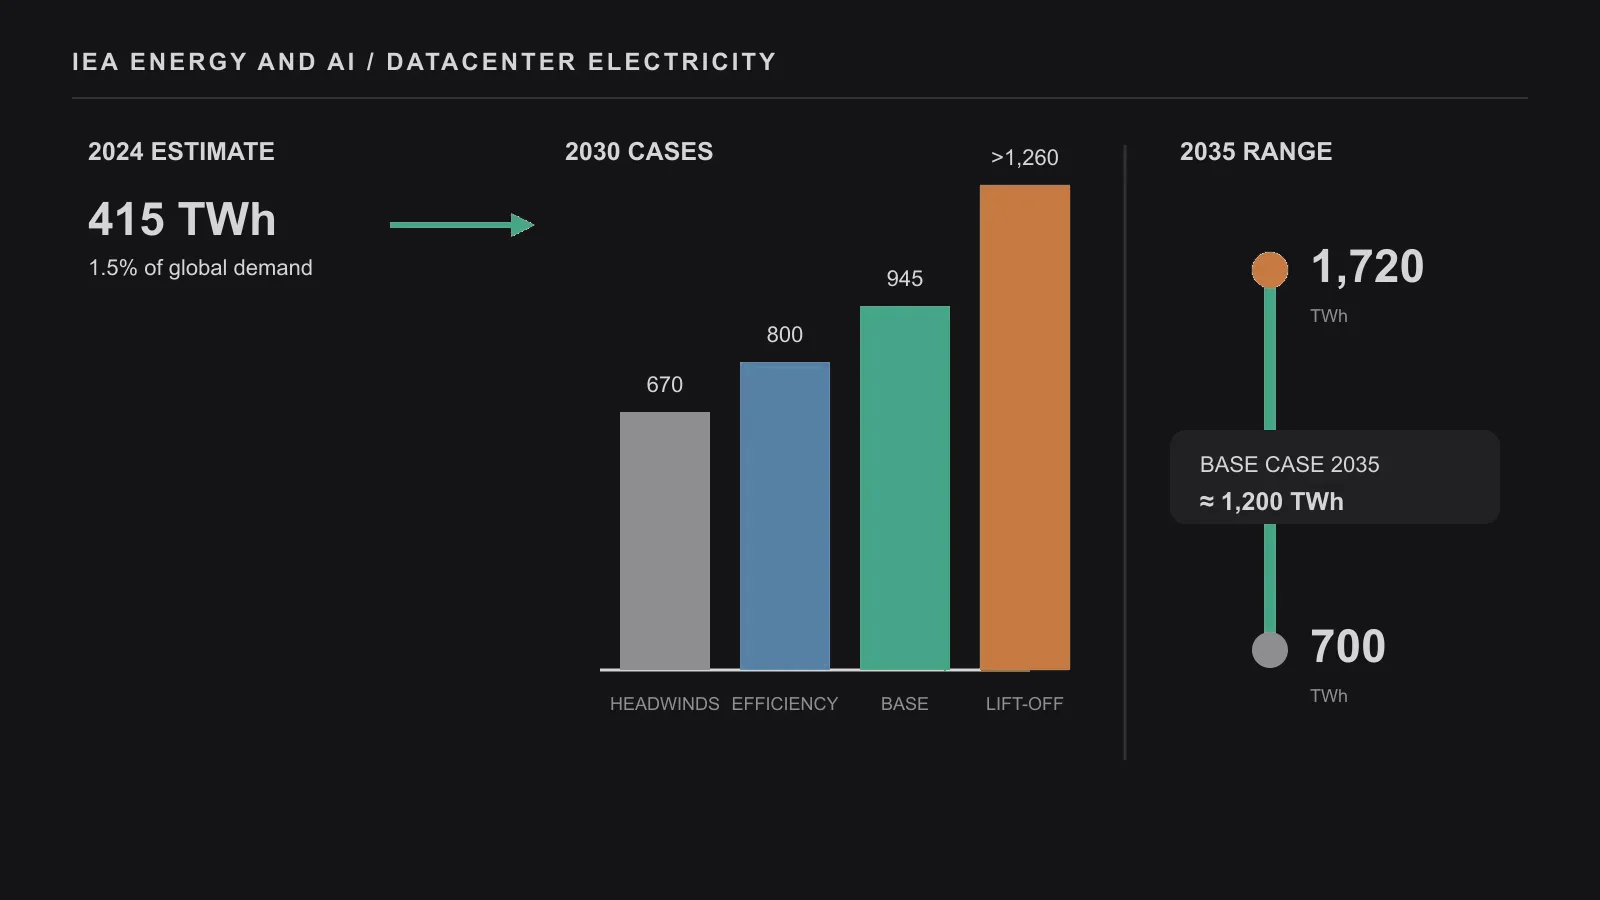
The easiest number to remember from the International Energy Agency’s 2025 report is 945 TWh. That is its Base Case estimate for global datacenter electricity consumption in 2030, up from about 415 TWh in 2024[1]. The share rises from 1.5% to just under 3% of world electricity demand. Read alone, 3% sounds either reassuringly small or alarmingly large. Both reactions miss the report’s more useful conclusion. Electricity is a global statistic, but datacenters connect to local grids.
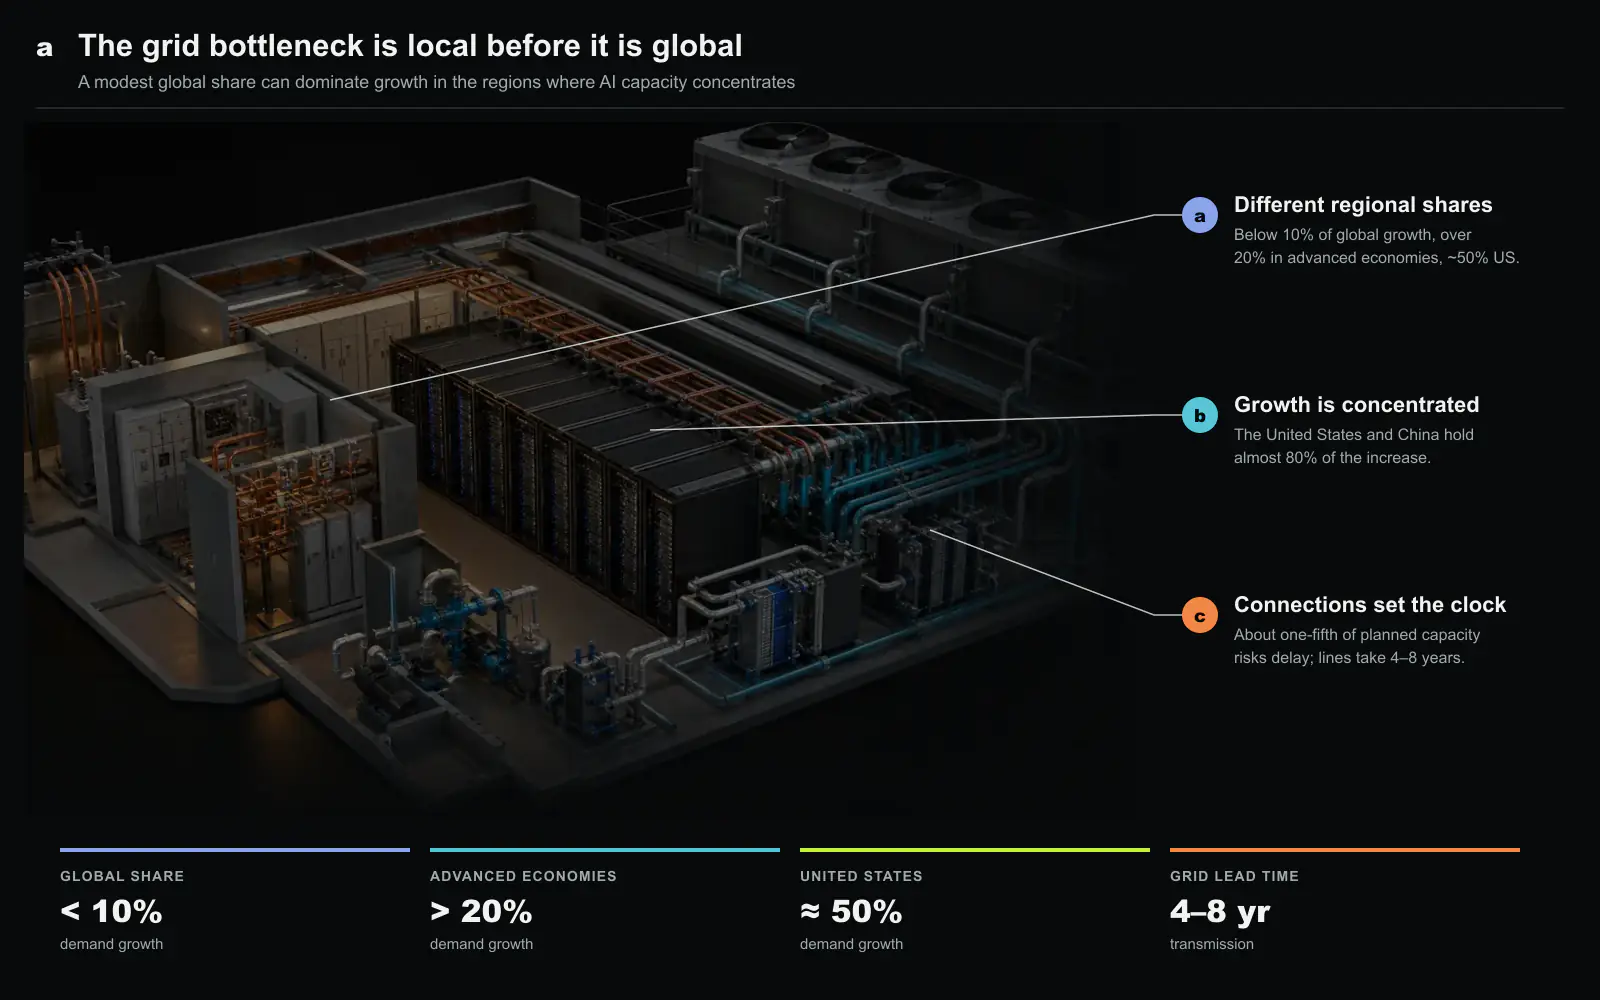
AI capacity arrives as a concentrated load. Nearly half of US datacenter capacity is located in five regional clusters. The United States and China together account for almost 80% of projected global datacenter demand growth through 2030. A single large site can draw power like an industrial plant, then request a connection in a market where several similar projects are already queued. The relevant question is therefore not only whether the world can generate another 530 TWh. It is whether a particular substation, transmission corridor and equipment supply chain can deliver hundreds of megawatts on the promised date.
945 TWh is a base case, not a measurement
The IEA builds its Base Case from industry expectations for server shipments, installed IT capacity, utilization, hardware efficiency and power usage effectiveness (PUE). Accelerated-server capacity grows almost fivefold by 2030, compared with 1.8× for conventional servers. Around 70% of the increase in server electricity use from 2025 to 2030 comes from accelerated systems. At the same time, average PUE improves from 1.41 to 1.29, avoiding about 90 TWh of demand and reducing cooling energy per unit of IT load by roughly 30%.
That combination explains why the forecast cannot be extrapolated from accelerator nameplate power alone. The stock and wattage of servers push demand upward. Better cooling, lower idle power and more efficient hardware pull it down. Utilization matters in both directions: an expensive AI server may perform more useful work per joule, yet operate for more hours at a high load.
The uncertainty band is wide. For 2030, the Lift-Off Case exceeds 1,260 TWh, the High Efficiency Case reaches about 800 TWh, and Headwinds reaches about 670 TWh. By 2035, the four cases span 700 to 1,720 TWh, while the Base Case is around 1,200 TWh. Lift-Off combines stronger AI adoption with fewer local energy constraints. High Efficiency keeps service demand on the base trajectory but improves hardware, software and facility efficiency. Headwinds assumes slower adoption and more infrastructure bottlenecks. These are conditional pathways, not confidence intervals.
A small global share can dominate local growth
Of the worldwide increase in electricity consumption through 2030, datacenters supply under one-tenth in the Base Case. The same load looks different when the denominator changes. In advanced economies, where demand has been nearly flat for years, datacenters contribute more than 20% of growth. In the United States they contribute nearly half. By 2030, US datacenters are projected to use more electricity than domestic production of aluminum, steel, cement, chemicals and other energy-intensive goods combined.
Existing concentrations already show the local effect. Ireland’s datacenters consume around 20% of metered electricity. Six US states are above 10%, and Virginia is around 25%. These shares are not a preview of the global average. They are evidence that an apparently modest worldwide load can become the defining customer of a regional power system.
The IEA estimates that grid constraints could delay about 20% of global datacenter capacity planned through 2030. An advanced-economy transmission build commonly lasts between four and eight years. The corresponding range in emerging economies is two to four years. Reported datacenter connection queues range from one to three years in the United States overall to as much as seven years in Northern Virginia and Germany, five to seven years in the United Kingdom, and up to ten years in the Netherlands. The volume of outstanding transformer orders expanded over 30% during 2024, while the transformer price index had risen 1.5× since 2020.
These figures describe schedule risk rather than an absolute shortage of global energy. Generation, grids and datacenters have different construction clocks. A campus can order servers against an 18-month plan while a transmission project remains in permitting. Duplicate or speculative connection requests further obscure which gigawatts are real. Capacity exists on a spreadsheet long before it can pass through the needed wires.
More electricity does not mean one supply source
Renewables provide about half of the additional electricity used by datacenters through 2035 in the Base Case, rising by roughly 450 TWh from today’s level. Natural gas generation serving datacenters increases by about 175 TWh over the same period. Coal contributes in some regions, while nuclear additions become more important after 2030. The IEA expects almost 20 GW of new nuclear capacity for datacenter supply between 2030 and 2035, mainly in the United States and China.
This mix also changes the emissions result. Electricity-related datacenter emissions peak around 320 Mt CO2 near 2030 in the Base Case and then ease as lower-emissions supply grows. That is less than 1% of global combustion emissions, but its regional effect is larger. Under Lift-Off, the curve stays near 475 Mt CO2 during the 2030s because more near-term demand is met with fossil generation. Annual renewable contracts do not by themselves prove that every hour of a facility’s load is served by a matching clean resource.
Flexibility helps only when the workload permits it
The report identifies location as the first flexibility lever. Training and some batch inference can tolerate distance from users, so a new cluster may be placed where generation, transmission and land are available. Interactive inference, data-sovereignty rules and access to skilled labor narrow that freedom. Existing network and talent hubs also reinforce themselves, which is why announced capacity continues to cluster even after power becomes scarce.
Time is the second lever. Some jobs can pause, shift to a low-price hour or move between regions. Real-time services cannot. Even flexible training has a cost because idle accelerators are expensive and distributed jobs may lose progress or efficiency when interrupted. Batteries, backup generation and thermal storage can shape the facility’s grid draw, but their duration and emissions vary. Flexibility should therefore be reported as a workload-specific operating range, not a claim that an AI campus can simply switch off.
The IEA forecast has limits. Server shipment expectations come from an industry that changes quickly, and public data on utilization, idle power and facility operations remain sparse. The 700 to 1,720 TWh range makes that uncertainty visible. Its practical value lies less in predicting the exact 2035 total than in aligning timescales. Chips improve in years, datacenters rise in a few years, and transmission can take most of a decade. AI infrastructure planning fails when those clocks are treated as one.
A megawatt is a place and a date, not only a quantity
The forecast changes the meaning of announced AI capacity. A campus described as 500 MW does not possess that capacity when the grid connection, transformers, generation contract, and cooling system arrive on different dates. Nor are 500 MW in a constrained hub equivalent to 500 MW beside expandable transmission. Infrastructure planning should treat power as a time- and location-stamped resource, much as a scheduler treats a GPU with a model, topology, and availability window.
This framing improves investment decisions. A developer can compare the cost of waiting for a preferred region with the cost of locating flexible training elsewhere, building dedicated generation, accepting temporary gas supply, or operating below the campus design point. The option value of a second site comes from an earlier and more certain energization date, not merely a lower electricity tariff. Conversely, an attractive power purchase agreement does not solve a substation or transmission queue.
The missing operating metric is deliverable compute under grid constraints. It should combine commissioned megawatts, hourly derating, carbon and water conditions, curtailment rights, and the workload’s ability to shift in time or space. Reporting only annual TWh hides whether a cluster can meet an interactive SLO during a stressed hour. Reporting only nameplate MW hides the months when equipment is present but cannot be energized. The IEA’s most actionable message is therefore local: AI growth will be limited first by coordination among project clocks, and the operator that can make workload placement follow those clocks gains capacity without waiting for the global energy system to settle.
A forecast should become a range of build plans
The 945 TWh base case is useful because it supplies one internally consistent path, not because demand will land exactly on that value. Model efficiency, utilization, hardware power, inference volume, training scale, cooling, and regional policy can all move the outcome. An infrastructure plan should preserve several scenarios and identify which decision changes at each boundary.
Some decisions are robust across the range. Grid interconnection, transmission, generation, and large-site permitting take long enough that waiting for precise AI demand can create a capacity shortage. Other decisions should remain conditional. The number of energized halls, backup equipment, and accelerator purchases can be staged as demand becomes visible. Separating long-lead enabling work from short-lead IT deployment reduces both shortage and stranded capital.
Every scenario needs a date and location. A global annual total cannot size a substation in one county or the transmission path serving one campus. Planners should translate workload growth into hourly load shapes at candidate sites, then apply realistic interconnection dates, outages, weather, and generation availability. This is where a modest global share can become a dominant local problem.
The interconnection queue is part of compute capacity
Accelerators can be delivered before power. A signed utility agreement can also precede the network upgrades required to serve the full load. Capacity reporting should distinguish requested, contracted, physically connected, commissioned, and continuously deliverable megawatts. Only the last category supports a production workload without relying on temporary or constrained arrangements.
Location decisions should compare more than electricity price. Available transmission, time to energization, generation mix, water and cooling conditions, fiber paths, equipment supply, and the ability to add later phases all affect completed compute. A cheap megawatt delivered three years late may be more expensive than a higher-priced megawatt available when the cluster is ready.
Cluster architecture can reduce this risk. Modular halls, staged power shelves, and schedulers that understand site limits let operators bring partial capacity online while the remaining infrastructure catches up. However, partial energization must preserve useful network and storage topology. Powering an arbitrary subset of racks can strand accelerators if jobs require connected islands of a specific size.
Flexibility needs a workload and recovery contract
AI load can support the grid when work can move in time or place, but the flexible portion is smaller than nameplate demand. Interactive inference, synchronized training stages, checkpoint windows, and data-locality requirements constrain when power may change. A flexibility offer should state which jobs can pause, how quickly, for how long, how often, and what recovery cost follows.
Fast power shaping can use device power limits and batch control without stopping work. Longer events may defer low-priority inference, pause fault-tolerant training at a checkpoint, or move new jobs to another region. Migration of a running large job is rarely free; data, state, and fabric availability can dominate the energy value. The grid payment should be compared with lost accelerator work and any risk to completion deadlines.
Reliability obligations also matter. A data center that promises demand reduction cannot count the same backup margin twice for its own failure response. Control systems should test utility signals, local overrides, communications loss, and restoration ramps. Returning the full fleet simultaneously after an event can create a larger pulse than the original reduction solved.
Energy accounting should keep local consequences visible
Annual electricity and emissions are important but incomplete. Hourly marginal generation, transmission constraints, backup operation, cooling water, and equipment construction can shift the local impact. Two sites with equal yearly renewable purchases can impose different grid and carbon consequences if one consumes during constrained hours and the other follows available supply.
Operators should report location-based and market-based emissions separately and show the time granularity of matching claims. They should also connect water and cooling metrics to weather and load rather than publish one annual ratio. These disclosures allow readers to distinguish procurement instruments from physical operation without dismissing either.
The useful denominator remains completed model work. Energy per token or training milestone should include accelerator, host, network, storage, cooling, and losses at the facility boundary. Quality and latency must be held constant. Lower energy per token can coexist with higher total demand when volume grows, so efficiency and absolute load should appear together.
We read the IEA forecast as a planning signal with local obligations. AI does not need to dominate world electricity to dominate the next substation, transmission project, or flexible-load program in a particular region. The prudent response is to secure long-lead grid capacity, stage short-lead compute, expose the workload’s genuine flexibility, and report the physical time and place attached to every megawatt.
Source and attribution
This article is an editorial analysis prepared by Silicon & Systems from the IEA’s 2025 Energy and AI report and dataset. The prose and both figures were created for this article from reported values; no source figure or table is reproduced. The report is available under the Creative Commons Attribution 4.0 International license. Copyright (c) OECD/IEA 2025. The full report, methodology and download links are available from the IEA report page.