An evenly loaded storage cluster can still make unrelated customers wait behind a small group of bursty workloads. Distributing requests across servers prevents one local hotspot, but it does not remove excess demand. If the burst is large enough, successful distribution can make many servers queue at the same time.
Alibaba Cloud and Tsinghua University’s NSDI 2026 study begins with that production observation[1]. Its block-storage service already uses several forms of load balancing, yet long-latency events remain. The proposed response changes admission at virtual-disk segment granularity instead of relying on another round of placement changes.
The paper then addresses a separate case: storage proxies with spare capacity still delay requests because unrelated tasks occupy their event loops. These are two mechanisms for two different causes. Treating both as a single overload problem would miss why a quiet cluster can need scheduling changes even after burst protection is installed.
How an effective balancer spreads interference
The examined service separates compute, proxy, and persistent storage. A VM’s block requests pass through a proxy that translates them into operations for the underlying distributed filesystem. That proxy also performs necessary maintenance and management work. It is more than a passive network forwarding step.
Virtual disks are divided into segments that different proxies can serve. Smaller logical blocks are distributed across those segments to spread localized accesses without creating an unmanageable number of metadata objects. The segment is therefore an allocation and control unit, not necessarily one contiguous hot address extent.
The production study finds relatively even request distribution among proxies: the measured coefficient of variation averages 0.12 in the illustrated analysis. Nevertheless, a sufficiently large demand increase pushes the whole group beyond its comfortable service rate. The relevant question changes from which server is overloaded to which traffic should enter while the shared resource is temporarily scarce.
Customer concentration makes this consequential. In sampled clusters, the three largest clients account for an average of 63% of traffic. They do not need to coordinate maliciously to produce correlated demand during a business event. Other customers can experience the resulting queues even though their own request rates remain steady.
These are observations from Alibaba’s workload, not a universal distribution for all cloud storage. A different provider should verify whether client identity, virtual-disk placement, and burst timing produce the same concentration. Aggregate utilization alone cannot reveal which request populations impose or suffer the interference.
Why coarse caps and migration miss the timescale
A fixed client-wide cap can reduce overload, but it also suppresses useful work when capacity is available. The paper reports a trial in which a restrictive bandwidth cap left 27% of proxy capacity unused on average. A large customer can also have many quiet segments alongside a few hot ones, making client-wide treatment unnecessarily broad.
Moving work to another cluster is slower than the common burst. The described cross-cluster migration can take roughly 20 minutes, whereas many observed bursts last less than 100 ms. Migration remains relevant to persistent imbalance, but it cannot be the main reaction to every short demand excursion.
The design instead distinguishes baseline service commitments from best-effort demand beyond them. That distinction is important: the objective is not to punish large clients for owning more disks. It is to prevent transient excess traffic from consuming the service needed by steady requests, including steady segments belonging to the same large client.
A per-segment monitor classifies recent traffic using short windows. Recovery to the steady class requires sustained behavior below the threshold, reducing rapid classification changes caused by jitter. The thresholds and history length affect which traffic receives protection, so they need to match the service’s actual commitments and workload timescale.
The second allowance is not new capacity
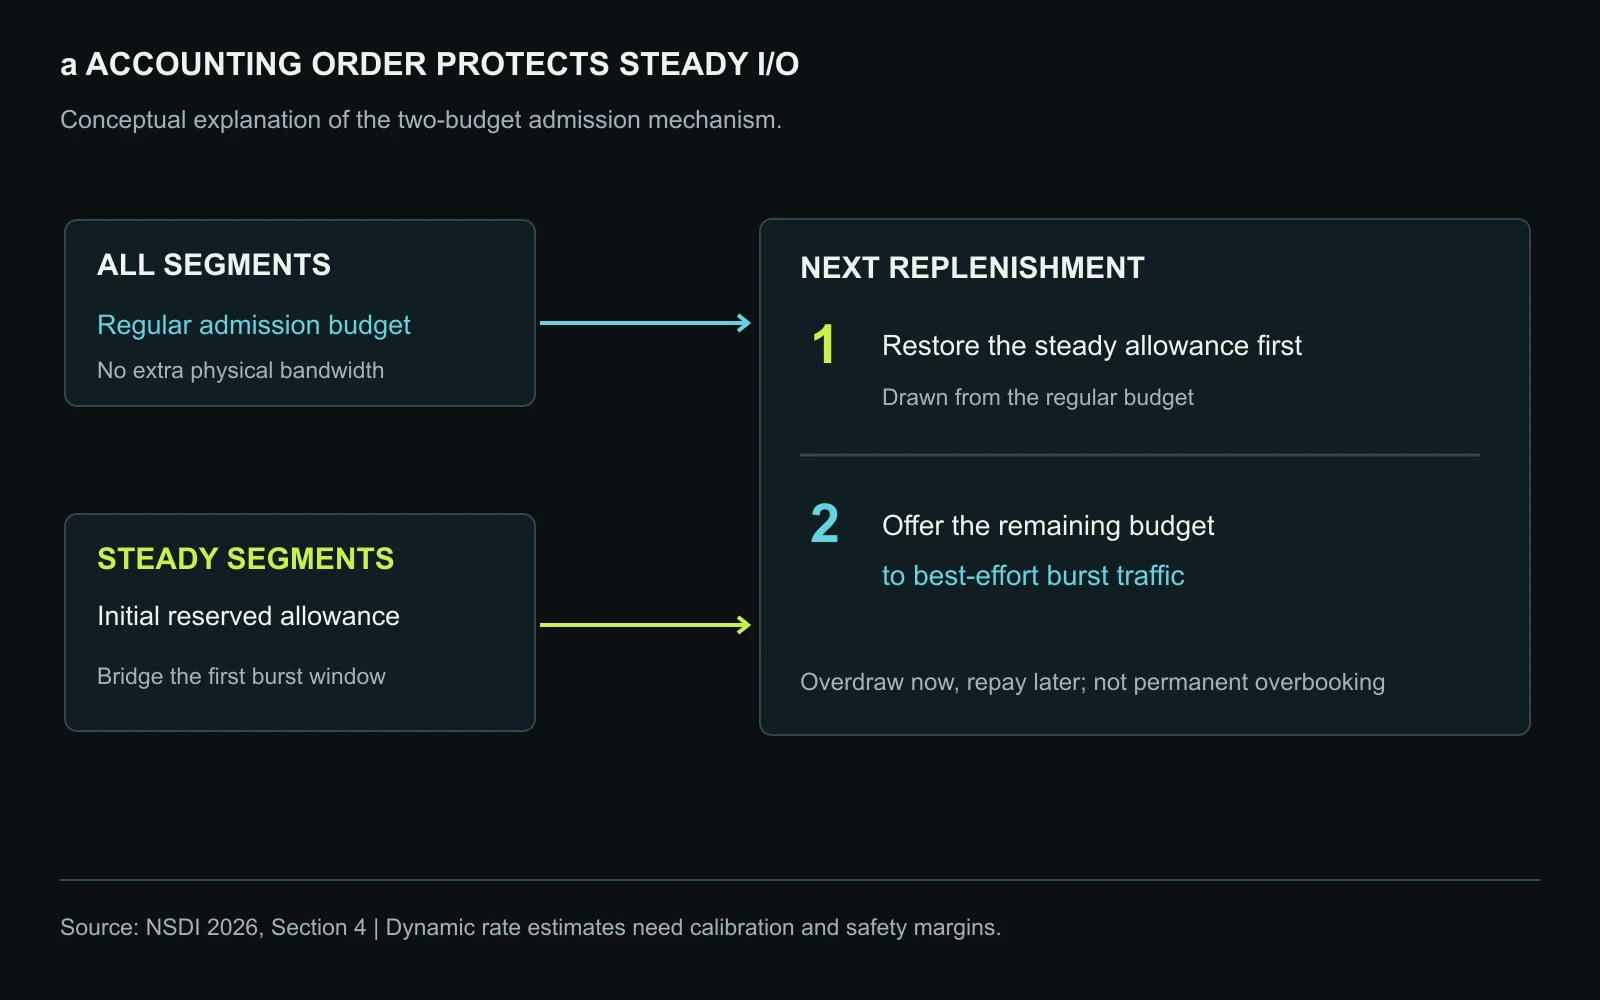
The admission controller maintains a main token pool available to all segments and a second allowance reserved for steady segments. Under ordinary conditions, requests use the main pool. When hot traffic depletes it, steady segments can use the reserved allowance rather than wait behind the entire burst.
The controller can briefly admit more work than the regular interval budget, using measured storage headroom. That borrowing is limited to the initial interval rather than continued indefinitely. Subsequent replenishment restores the reserved allowance before distributing the remaining main tokens, so persistent hot traffic receives less of the next budget.
This accounting is central to the mechanism. Drawing from the second allowance does not create additional SSD throughput or make prolonged oversubscription safe. It changes which requests get timely service and shifts when the burst is absorbed. Without repayment and a limit on the initial excess, the controller would merely move queueing deeper into the storage system.
The deployed interval is 10 ms, and the paper describes an initially configured reserved portion of 20% that can be adjusted. These are operating choices, not standards for every block store. A larger allowance can improve protection for steady segments while worsening pressure on hot traffic or the backend; a smaller one may fail to prevent the interference being targeted.
A short-window signal for a very long tail
The controller cannot wait for a highly stable estimate of the 99.999th percentile before reacting to a short burst. That percentile needs many observations, while demand can change within milliseconds. The implementation therefore uses more frequent P95 measurements and a calibrated queueing model to estimate remaining service capacity.
The engineering idea is reasonable but conditional: a more readily observed percentile acts as a proxy for the system’s current pressure. The fit includes correction and safety margins because real arrivals and service times do not obey an ideal queue exactly. Changes in request sizes, garbage collection, device behavior, or concurrency can change that relationship.
The printed equations contain a sign inconsistency: as written, positive load slack and a percentile between zero and one would produce a negative time. We do not reproduce those expressions as an executable controller specification. The operational result should be understood through the described measurement, calibration, and admission mechanism, not by copying the formula without checking its derivation and units.
A deployment should therefore validate prediction error around the intended operating range and retain a conservative fallback. A fit that works in normal conditions may become least reliable near saturation, precisely where an excessive allowance is most dangerous. The safe budget needs to account for model error as well as the average measured spare capacity.
Idle capacity does not imply prompt event handling
Under low load, the problem moves from admission to execution order. The proxy’s event loop processes I/O work along with monitoring, statistics, and other tasks. A newly arrived request can wait for that existing batch even when the machine has no sustained capacity shortage.
Moving some background work to separate threads helps, but tasks sharing critical data structures cannot always be moved cheaply. Additional synchronization can replace queueing with contention. The paper seeks a smaller change to the existing event-driven implementation rather than a wholesale runtime replacement.
The revised loop separates I/O-related tasks from unrelated ones and handles the I/O queue first. It limits time spent on the unrelated work before reconsidering incoming requests. Receive-buffer checks are also placed so that a drained I/O queue does not leave new work undiscovered behind an unnecessarily long loop.
The nominal 10-microsecond loop parameter is not a per-request latency guarantee or a hardware preemption timer. I/O work is not interrupted merely for crossing that threshold, and a running task can extend the loop. It is a scheduling budget that constrains how background work delays the next opportunity to process I/O.
Maintenance cannot be deferred forever
Strictly prioritizing I/O introduces another failure mode. Health checks and management tasks still need progress. If they never run, the control system can interpret the proxy as unhealthy and shut it down even while foreground traffic is being processed.
The design consequently adjusts the loop allowance based on time already spent on I/O. Its configured multiplier leaves room for unrelated tasks even when the foreground queue is active. This is a relative scheduling allowance, not a fixed reservation of exactly one-fifth of every CPU across the machine.
That distinction matters for operational validation. Background progress should be measured directly, including the age of health checks and pending maintenance. A better foreground percentile is not sufficient if it is achieved by silently accumulating work that will later force a pause or a restart.
This yields a broader systems lesson: short-latency service requires controlling both entry to a scarce resource and the timing of work already inside it. A rate limiter cannot fix an event loop that fails to notice new arrivals promptly. An I/O-priority loop cannot manufacture backend capacity during a sustained burst.
Production evidence and its measurement populations
The paper separates controlled tests, production-trace replay, and deployed observations. The controlled environment uses eight compute nodes and sixteen storage-side nodes, with 32-core processors, 192 GB memory, and dual 25G networking. Storage nodes include enterprise NVMe devices. Synthetic read/write mixtures and request sizes expose the mechanisms under repeatable conditions.
The largest reported microbenchmark reductions are not the deployment averages. In particular, the often-highlighted reduction of up to 97% belongs to specified burst tests. Trace replay also has its own results and does not become a live fleet experiment merely because the input came from production.
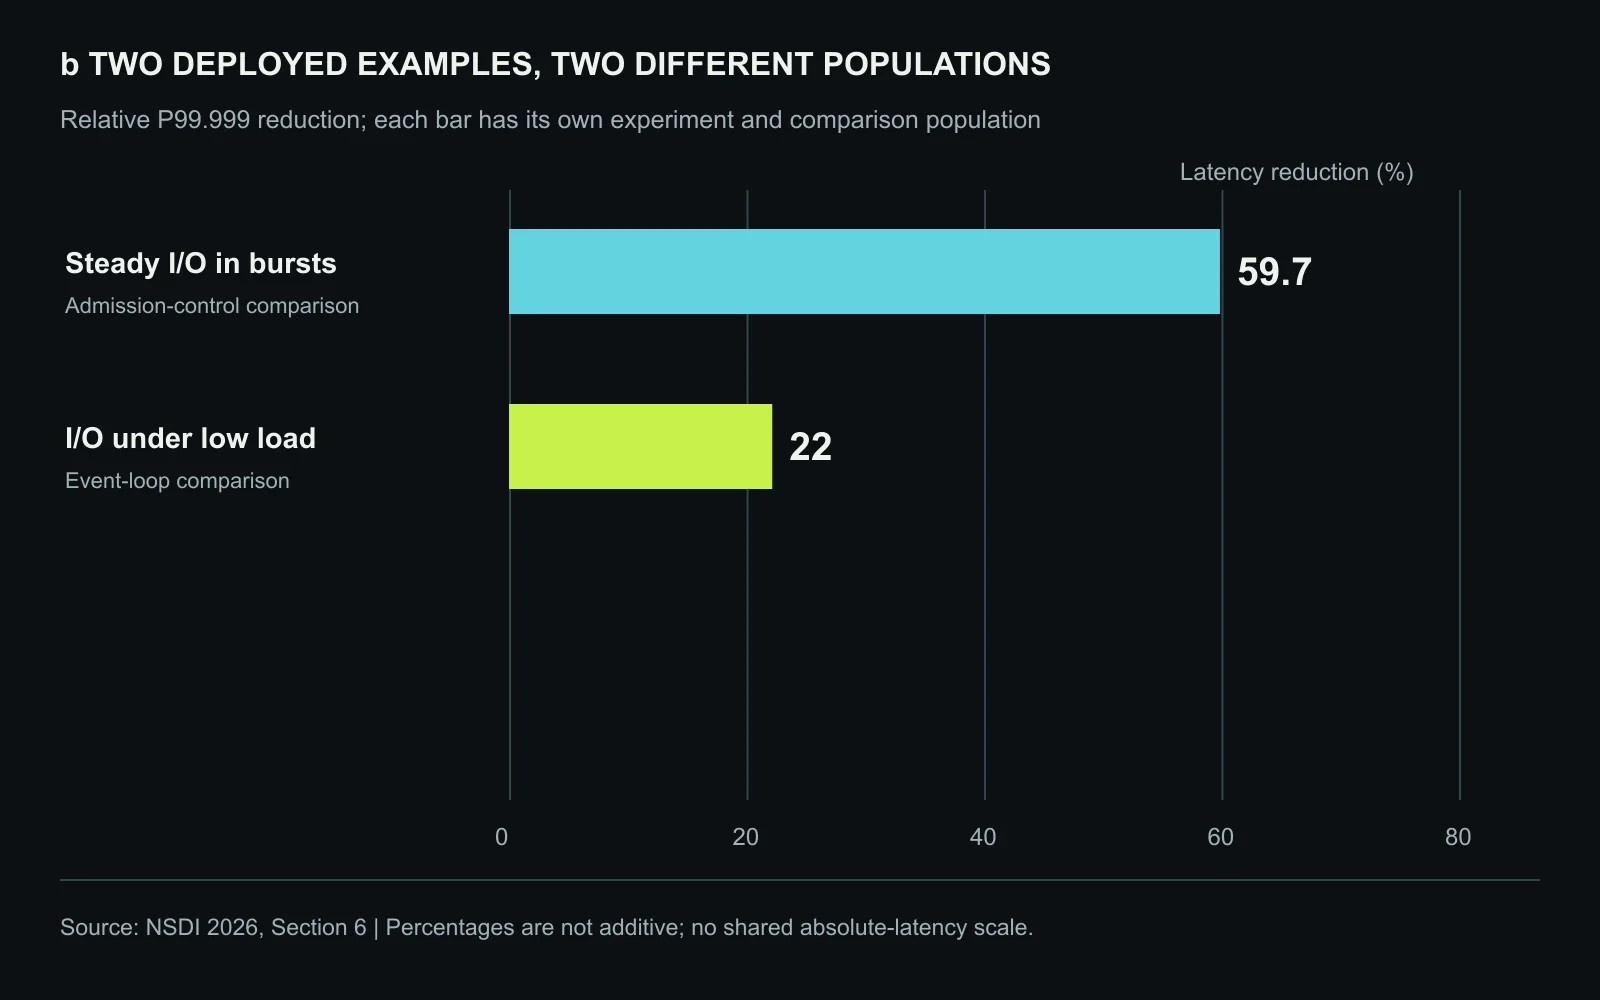
The deployed burst example reports a 59.7% reduction in P99.999 latency for steady segments around a recurring burst period. The underloaded study reports a 22% reduction, with a week-long comparison of two selected proxies in one cluster and the scheduler enabled on one of them. These refer to different conditions and request populations.
The reported rollout spans dozens of clusters. Over a period exceeding three months, the mechanisms served hundreds of trillions of I/Os. That establishes operational exposure, but it does not mean every plotted comparison is a randomized experiment across that whole population. The scope of the rollout and the scope of an individual measurement must remain separate.
Relevance to AI infrastructure
AI services can depend on block storage for metadata services, stateful databases, model loading, or other supporting operations. A delayed storage request can matter if it lies on a synchronous path. However, this paper does not measure training-step time, GPU utilization, or LLM serving throughput, and those gains should not be inferred from its storage percentiles.
The first useful measurement is whether the service’s slow operations coincide with a few hot segments or with event-loop stalls at low load. Segment-level attribution can distinguish a local demand burst from a fleet-wide capacity shortage. Task-level tracing can distinguish time spent executing useful I/O from time spent waiting for unrelated work.
We believe the adoption value lies in protecting a specific service obligation without permanently discarding spare capacity. That requires an accurate definition of steady traffic, calibrated headroom, bounded borrowing, and observable maintenance progress. The paper offers a practical implementation in Alibaba’s stack; other systems should transfer those principles only after verifying their own admission points and execution model.
Sources and rights
This is an independent editorial analysis of the final NSDI 2026 paper. The author credit follows the printed paper, whose author line includes Shu Ma in addition to the names on the proceedings cover. Original-paper copyright remains with the authors under USENIX publication terms, © 2026. All figures are newly created; original illustrations, table arrangements, and prose are not reproduced.