Compiler and operating-system engineers often search for a small number of expensive functions. Event-based sampling works well in that shape because frequent interrupts eventually identify the dominant cost. A smartphone rendering path can look different: thousands of short functions each contribute a small share, frame deadlines make one-percent changes material, and repeated runs include uncontrolled variation. The profile is flat precisely where an optimizer needs a trustworthy comparison.
The Blink paper begins with a failure that is more serious than noisy ranking. An ARM Large System Extension optimization replaced a retrying atomic sequence with fewer instructions, yet Linux perf repeatedly reported a higher instruction count. Engineers investigated the code for weeks before concluding that the measurement, not the optimization, was wrong. A profiler that reverses the sign of a change can promote a regression or reject useful code.
Blink changes the observation model. Instead of waiting for asynchronous samples, it marks selected function boundaries and reads hardware performance-monitoring counters in the executing thread. Instrumentation adds work, so the system combines precise counting with a hard trace budget and a cheap disabled path. The central judgment is not that tracing universally beats sampling. It is that controlled instrumentation is the appropriate reference when the expected effect is smaller than the sampler’s structural bias.
Sampling error is directional
Hardware counters overflow and interrupt the processor after an event threshold. The recorded instruction pointer is not necessarily the instruction that caused the overflow. Pipeline state, interrupt delivery, and out-of-order effects create skid. Long-latency instructions also delay retirement of following instructions and accumulate samples, producing a shadow that can make a stall site look disproportionately expensive.
Random error decreases with repeated experiments. Directional error does not. If a new instruction is slower but replaces several fast instructions, the optimized program may execute less work while the sampler assigns more observations to the remaining slow instruction. More samples can reinforce the wrong answer. This distinction explains why confidence intervals alone cannot validate a flat profile.
Short-lived functions create a second coverage problem. A timer can run at tens of kilohertz and still miss code that completes between interrupts. Raising the rate increases kernel activity, cache disturbance, and battery cost, while mobile thermal controls can change the workload being measured. The paper reports a tuning case in which perf required more than 50 repetitions, whereas Blink stabilized after two runs.
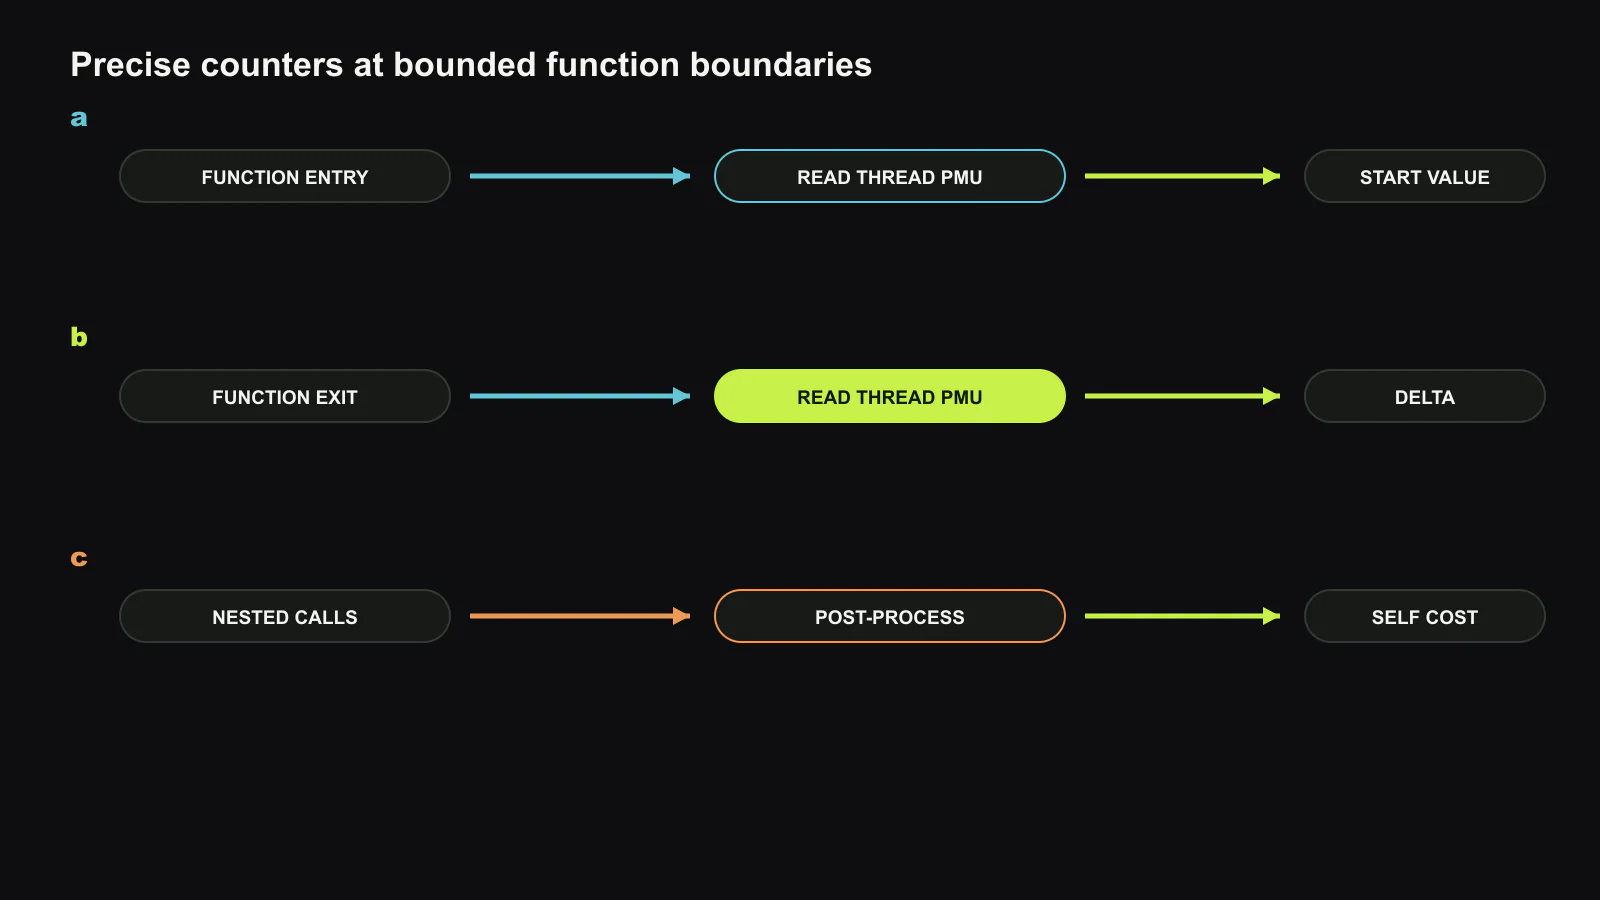
Boundary deltas establish an accounting identity
Blink places a trace point at function entry and at every exit. Each point reads the chosen PMU event and stores the counter value with a function and trace-point identifier. Subtracting entry from exit gives the inclusive event count. Post-processing removes nested child intervals to derive self cost, so the same data can answer both call-tree and flat-profile questions.
The measurement stays in the target thread. Per-thread buffers avoid a shared lock and most cross-core coherence traffic. Blink saves the registers used by the probe, invokes a compact tracing routine, and restores application state before resuming. Reading the PMU is not free, but the cost is deterministic enough to measure and subtract from comparisons.
Instrumentation coverage is selectable. Engineers can include a library, function set, or code region instead of rebuilding a separate bespoke benchmark for every hypothesis. A cap on recorded invocations prevents a tiny hot function from filling memory or dominating runtime. Once the cap is reached, that point can be disabled while other points continue collecting coverage.
Binary rewriting makes disabled tracing cheap
Always calling a probe would violate the expectation that a production binary behaves normally when profiling is off. Blink reserves an instrumentation sequence whose first instruction can be changed into a branch over the tracing body. Enabling and disabling therefore changes a small, known code region rather than relinking the program.
This design also supports adaptive budgets. A controller can activate a suspected region, collect enough invocations, and turn it off. The disabled path is a single jump, which matters because the probes remain in frequently executed mobile code after the diagnostic window closes.
Self-modifying code has correctness obligations. Instruction-cache visibility, page permissions, thread synchronization, and partially patched sequences must be handled for each supported architecture. The paper targets ARM64 in Huawei’s mobile environment; a general production implementation needs equivalent patching rules for every ISA and operating-system security policy.
Accuracy needs a ground truth, not agreement with perf
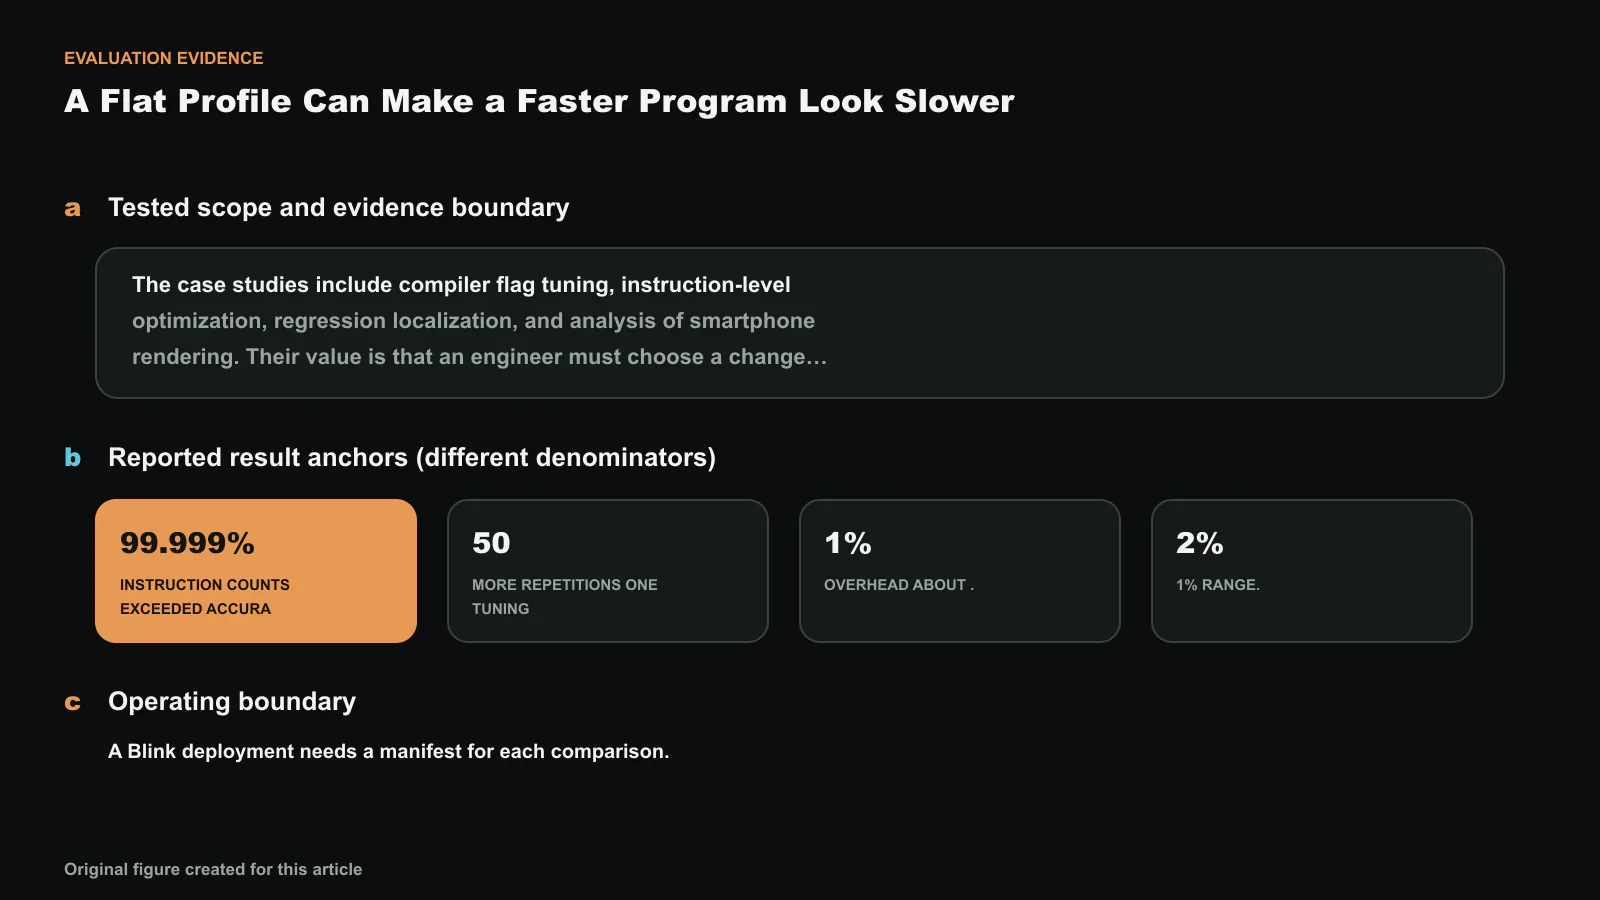
The authors validate retired-instruction measurements against controlled ground truth rather than treating another statistical profiler as authoritative. Across the tested functions, Blink’s counts exceed 99.999% accuracy. They also test operation without instruction-synchronization barriers because engineers use other PMU events where adding a barrier would perturb execution.
The overhead evaluation uses a Huawei HiSilicon KIRIN 9000S phone and real rendering interactions, including a large-picture camera workload. User-visible frame drops are the primary metric because a profiler can report accurate counters while changing scheduling or thermal behavior. Blink increases that critical metric by roughly 1% in the reported configuration.
Memory cost comes primarily from per-thread buffers. Reported maxima vary with the workload and thread count, from hundreds of kilobytes to several megabytes. That is modest for a developer build but not negligible for every mobile process. Buffer size, invocation caps, and selected regions therefore belong in the experiment specification.
Production cases test decisions, not only counters
The case studies include compiler flag tuning, instruction-level optimization, regression localization, and analysis of smartphone rendering. Their value is that an engineer must choose a change, not merely admire a profile. Stable measurements shorten a search whose candidate space can contain many compiler configurations.
Blink is particularly suited to A/B questions: did a changed function execute fewer instructions, incur fewer cache misses, or reduce cycles under the same interaction? It is less naturally a fleet-wide always-on profiler. Instrumented binaries, trace-point selection, and buffer collection require an explicit diagnostic workflow.
The paper’s own limitations matter. The current deployment is centered on ARM64 mobile devices, and the authors say broader production use requires more comprehensive worst-case overhead evaluation in the 1% to 2% range. Complex binaries may also need more capable rewriting, and counter semantics differ across processors.
Choose the profiler from the expected signal
An observability stack should not standardize on one profiler for every question. Sampling remains attractive for continuous, broad fleet observation and obvious hotspots. Boundary instrumentation is justified when a flat profile, a short function, or a sub-percent optimization makes attribution error comparable to the signal.
A practical policy can use sampling to discover a region and Blink-like tracing to adjudicate the final change. The handoff should preserve build identity, device model, thermal state, selected PMU event, probe set, invocation cap, and repeated-run distribution. Without that metadata, a precise number can still be operationally incomparable.
The broader systems lesson is that low overhead and high accuracy are not scalar properties. They depend on workload shape and on the decision being made. Blink earns its value by making the measurement contract explicit: it spends bounded synchronous work at known boundaries to avoid an unbounded inference from biased samples.
An experiment should be reproducible at the trace boundary
A Blink deployment needs a manifest for each comparison. The manifest should name the exact binary and symbols, enabled functions, counter event, core type, trace budget, device power mode, thermal starting point, and interaction script. Counter multiplexing should be avoided or reported because rotating events changes the observation interval. Control and treatment runs should be interleaved so temperature drift does not become an apparent compiler effect.
Engineers should also retain raw boundary records long enough to audit the reduction. Inclusive and self cost can disagree when recursion, exceptions, tail calls, or asynchronous work cross the selected boundary. A result is ready for a production decision only when the trace captures the relevant lifetime, repeated runs agree, and a user-visible metric confirms that the instrumentation did not alter the behavior being optimized.
Source and copyright notice
This article is an editorial analysis by Silicon & Systems. It restates the mechanisms, measurements, deployment cases, and limitations in our own words. No source sentence, table, or figure is reproduced; the figure was created for this article. The paper is available from the USENIX OSDI 2026 presentation page. Copyright remains with the authors, 2026.